
This is a title
Identifying Similar Systems (CA)
Why this matters
There's no official definition of "similar" for California school systems — no rule about how close your demographics have to be. So comparison is a judgment call, and if you use your exact numbers you'll just match yourself.
This guide gives you working parameters that get you to a useful peer group: ideally 10–20 systems that look like you, hopefully including a few doing better that you can learn from.
Who it's for
- Administrators setting goals against realistic peers ahead of planning or board cycles — and looking to connect with like systems to find solutions that improve student success
- Anyone who's heard "compare to similar systems" and wondered what similar actually means
Step-by-step
Select your agency and metric to compare first
Selecting your agency pulls the most current public numbers for your economically disadvantaged %, English learner %, and students with disabilities %. Those three — plus enrollment — do most of the narrowing.
Under View, select the area you'd like to compare.
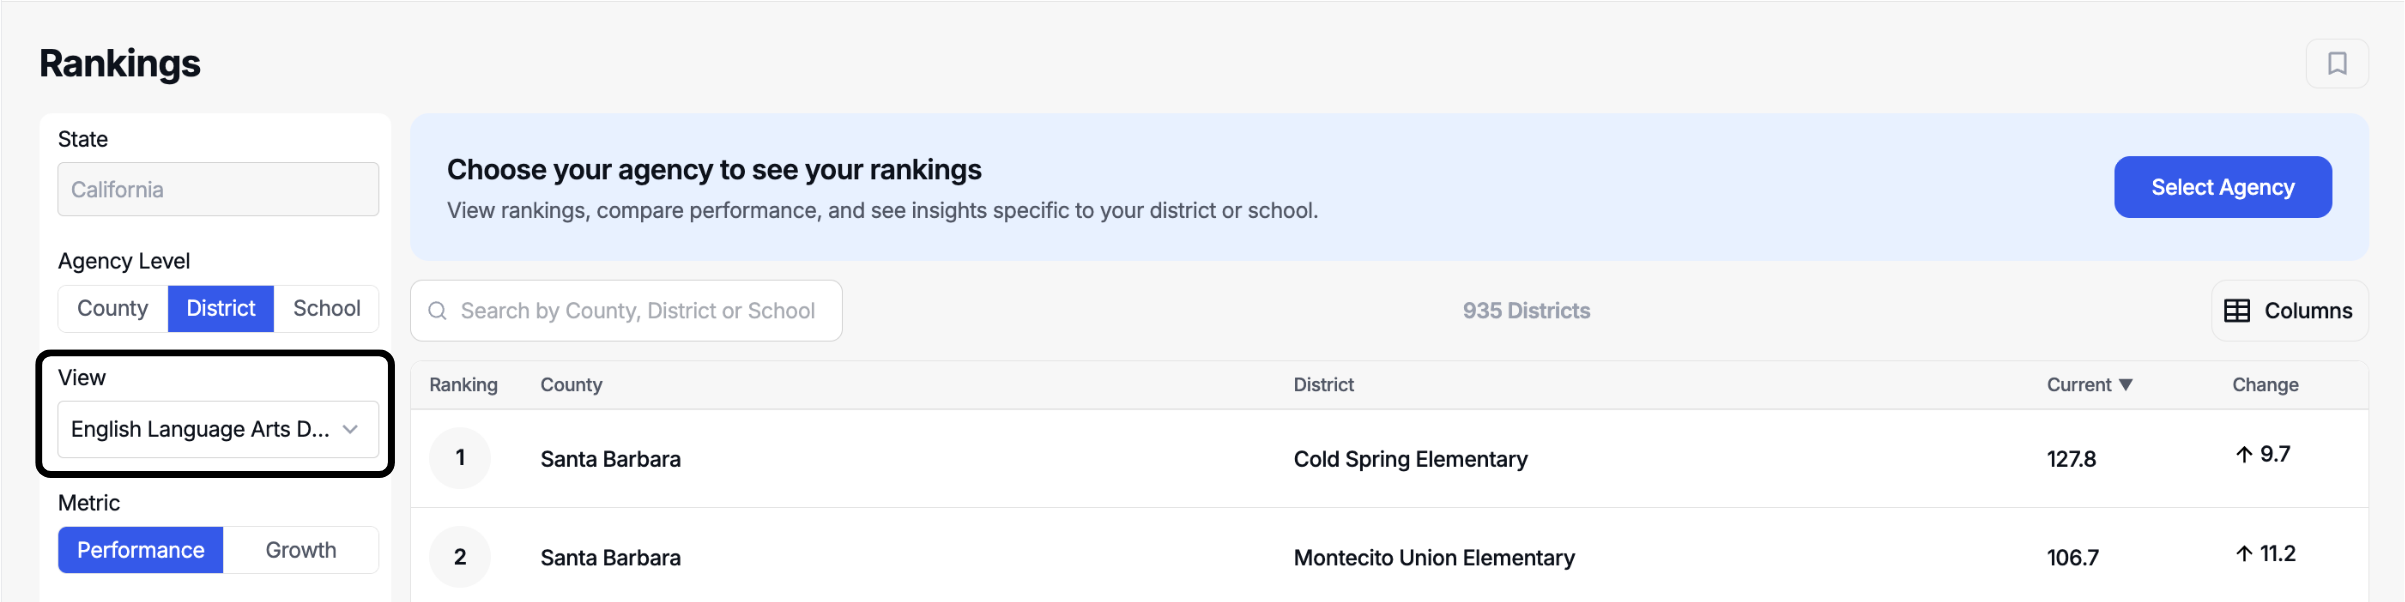
What we skip: Foster and other very small-count groups usually aren't useful for narrowing — the numbers are tiny for almost everyone. Lean on enrollment, economically disadvantaged, and English learners.
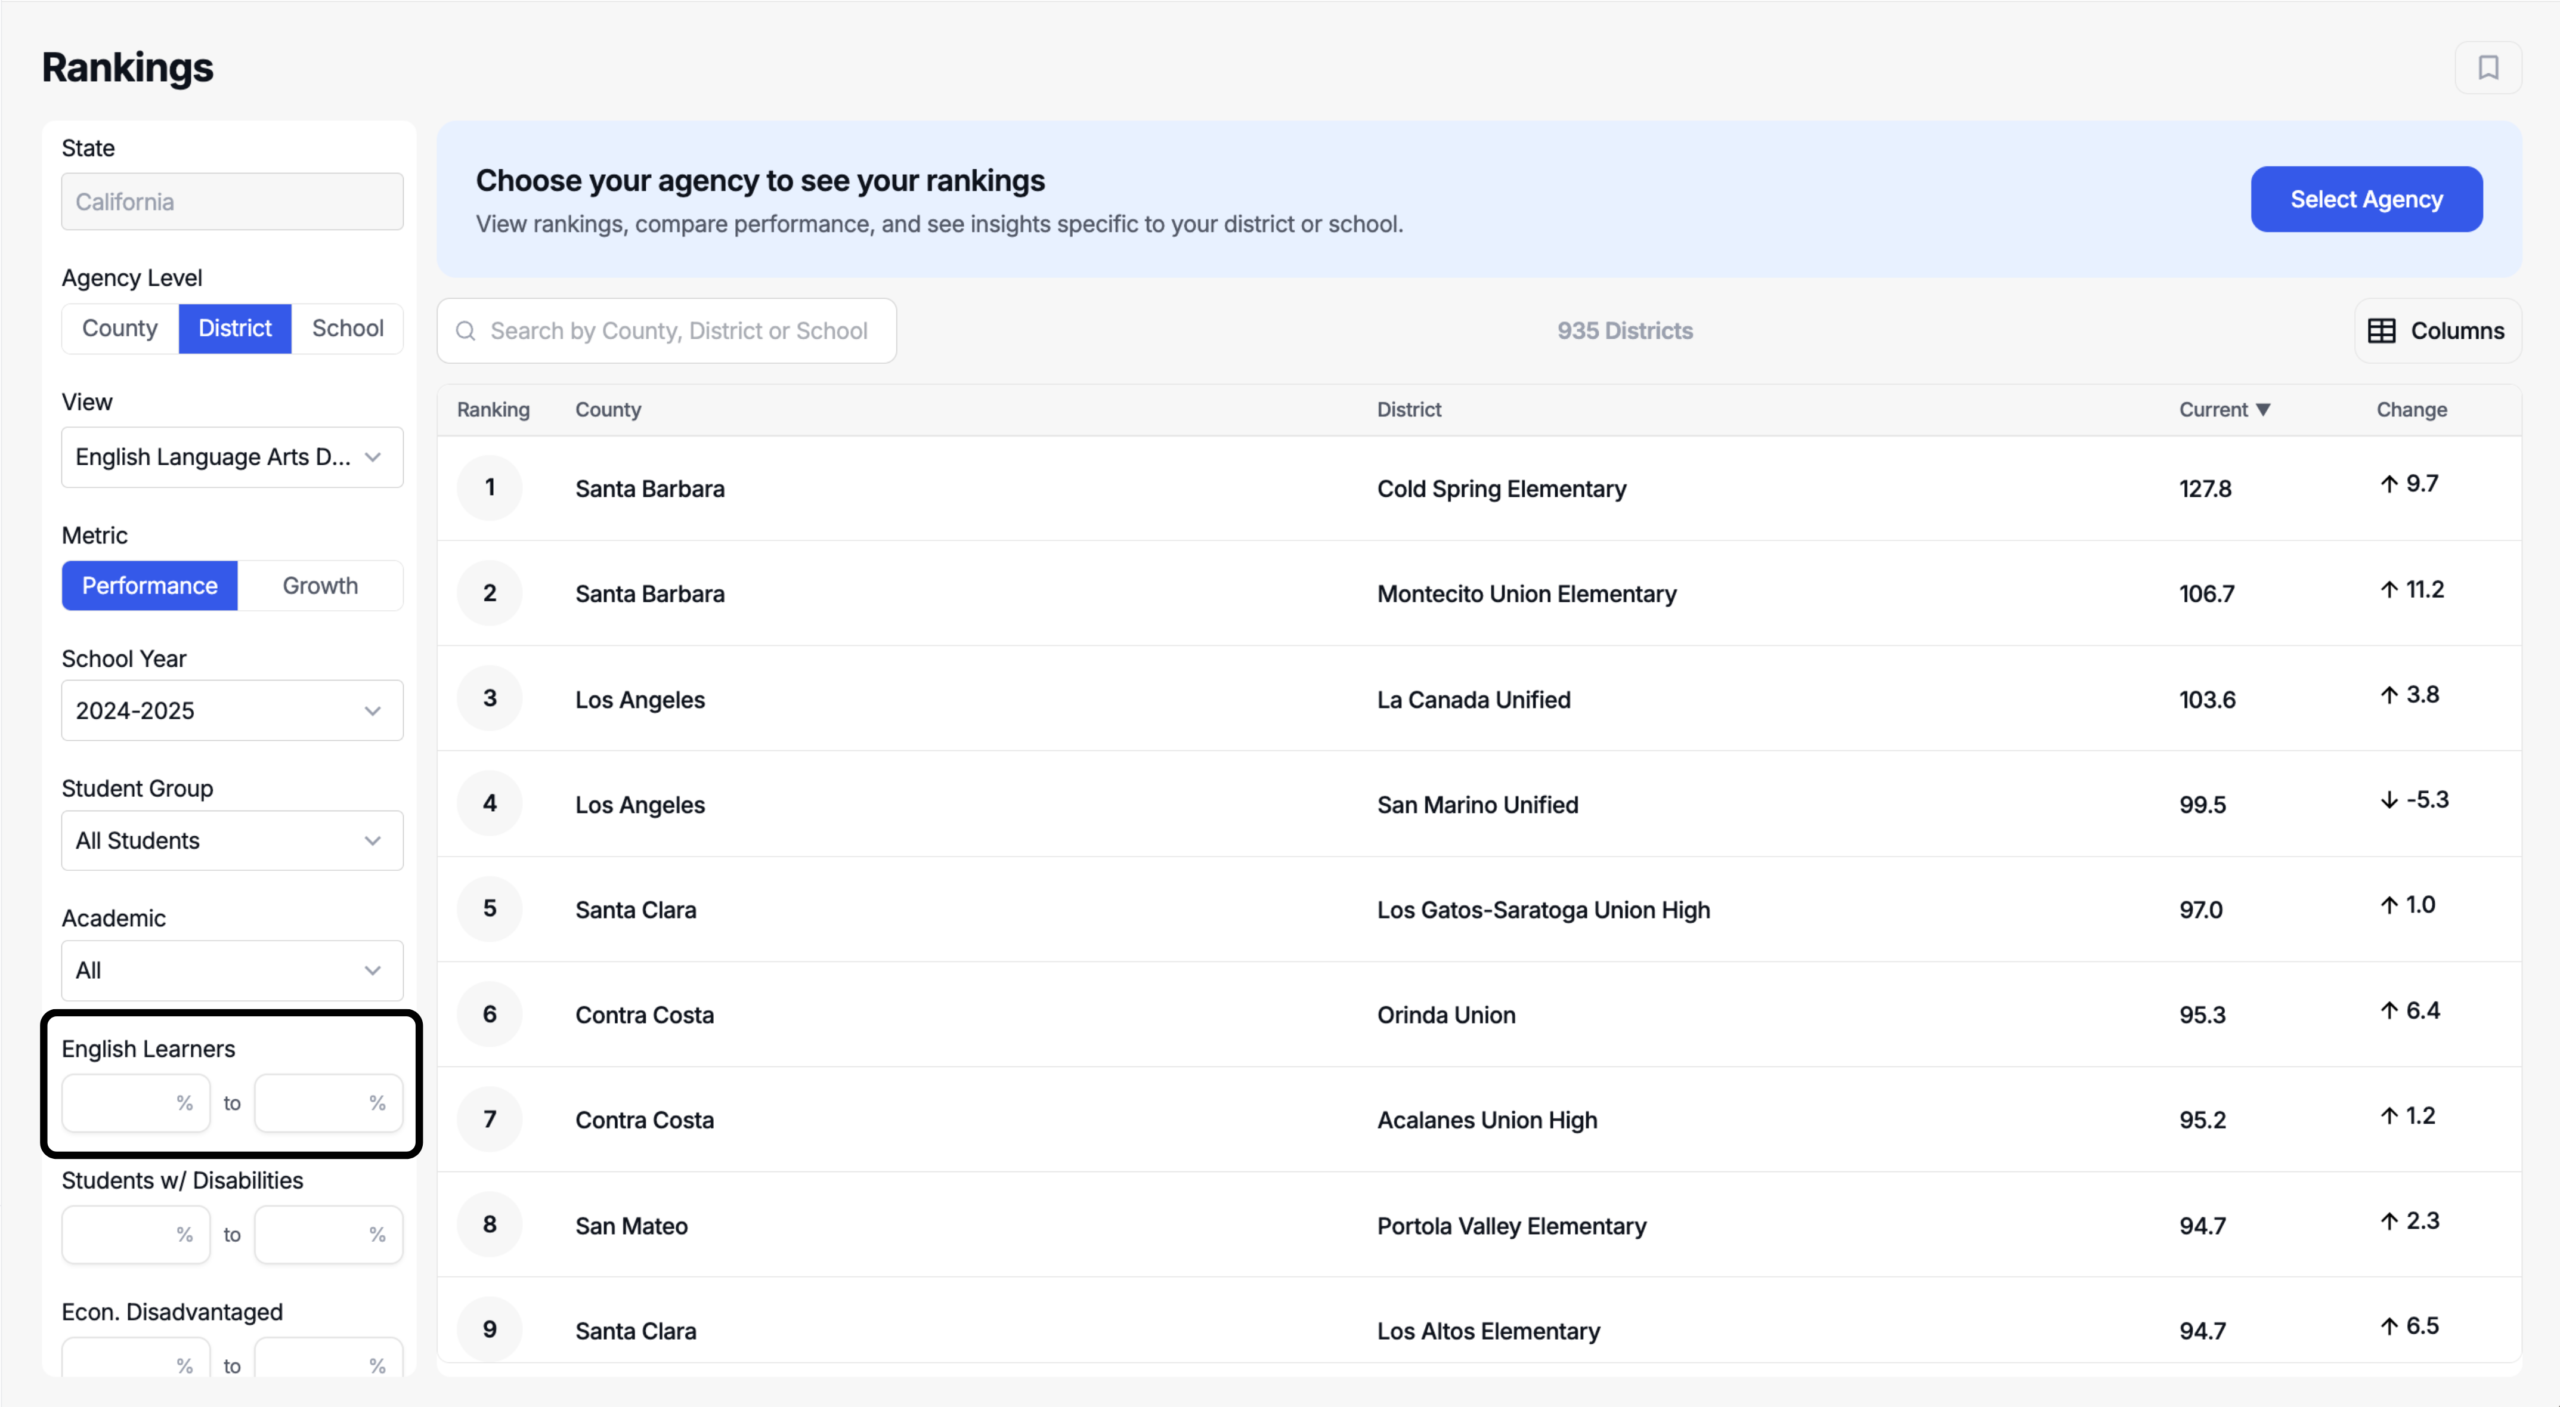
Set English learner bands
English learner percentages span a huge range in California, so treat roughly 20% as a dividing line and stay on one side of it:
- Low EL systems: try under 5%, then under 10%, then under 15%, then under 20% as your thresholds
- Higher EL systems: try 20%+, or narrow to something like 20–35% or 28%+
The idea is to stay within a band rather than straddle that 20% line — above and below it are genuinely different contexts.
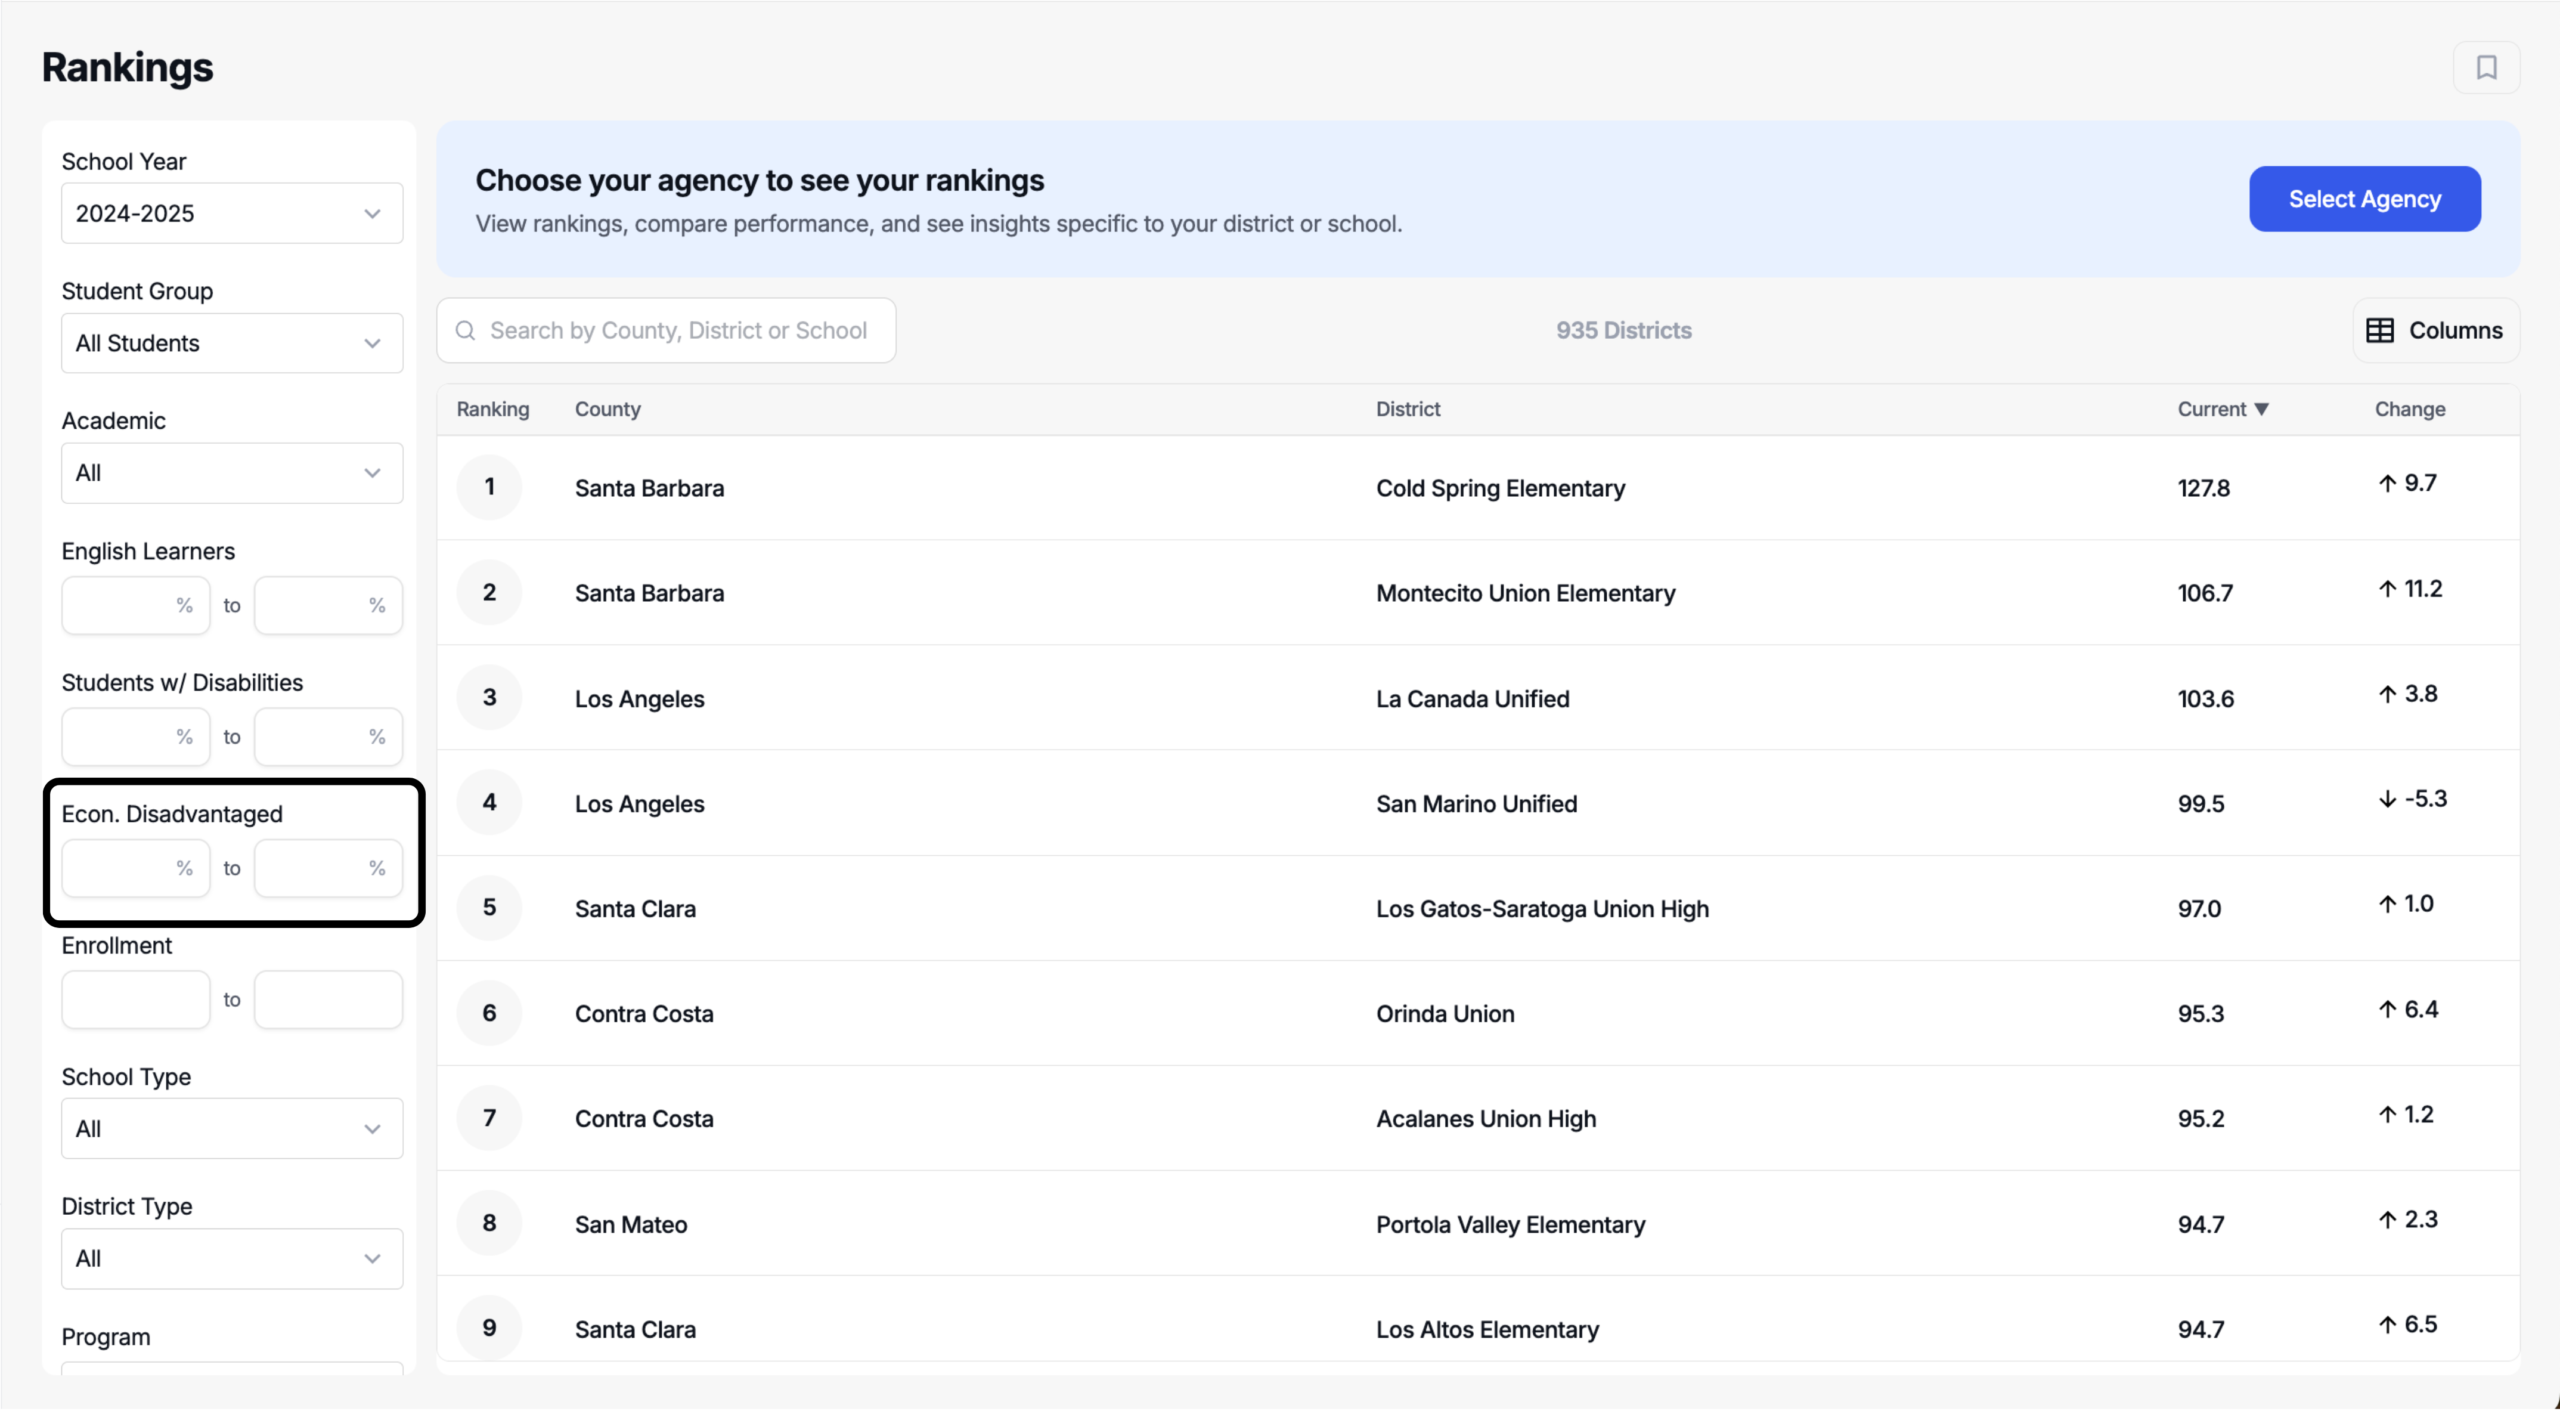
Set economically disadvantaged range
A good default is 10% on either side of your number:
- At 50% → filter 40–60%
- At 20% → filter 10–30%
At the extremes, go one-sided instead:
- At 85% → 80%+ (leave the top blank; it reads to 100%)
- At 95% → 90%+
Set an enrollment window
Use 25–50% on either side of your enrollment, scaled to your size:
- A 500-student system at 50% → 250–750
- A 9,300-student system → 50% is too wide, so tighten to 7,000–11,000 (roughly 25%)
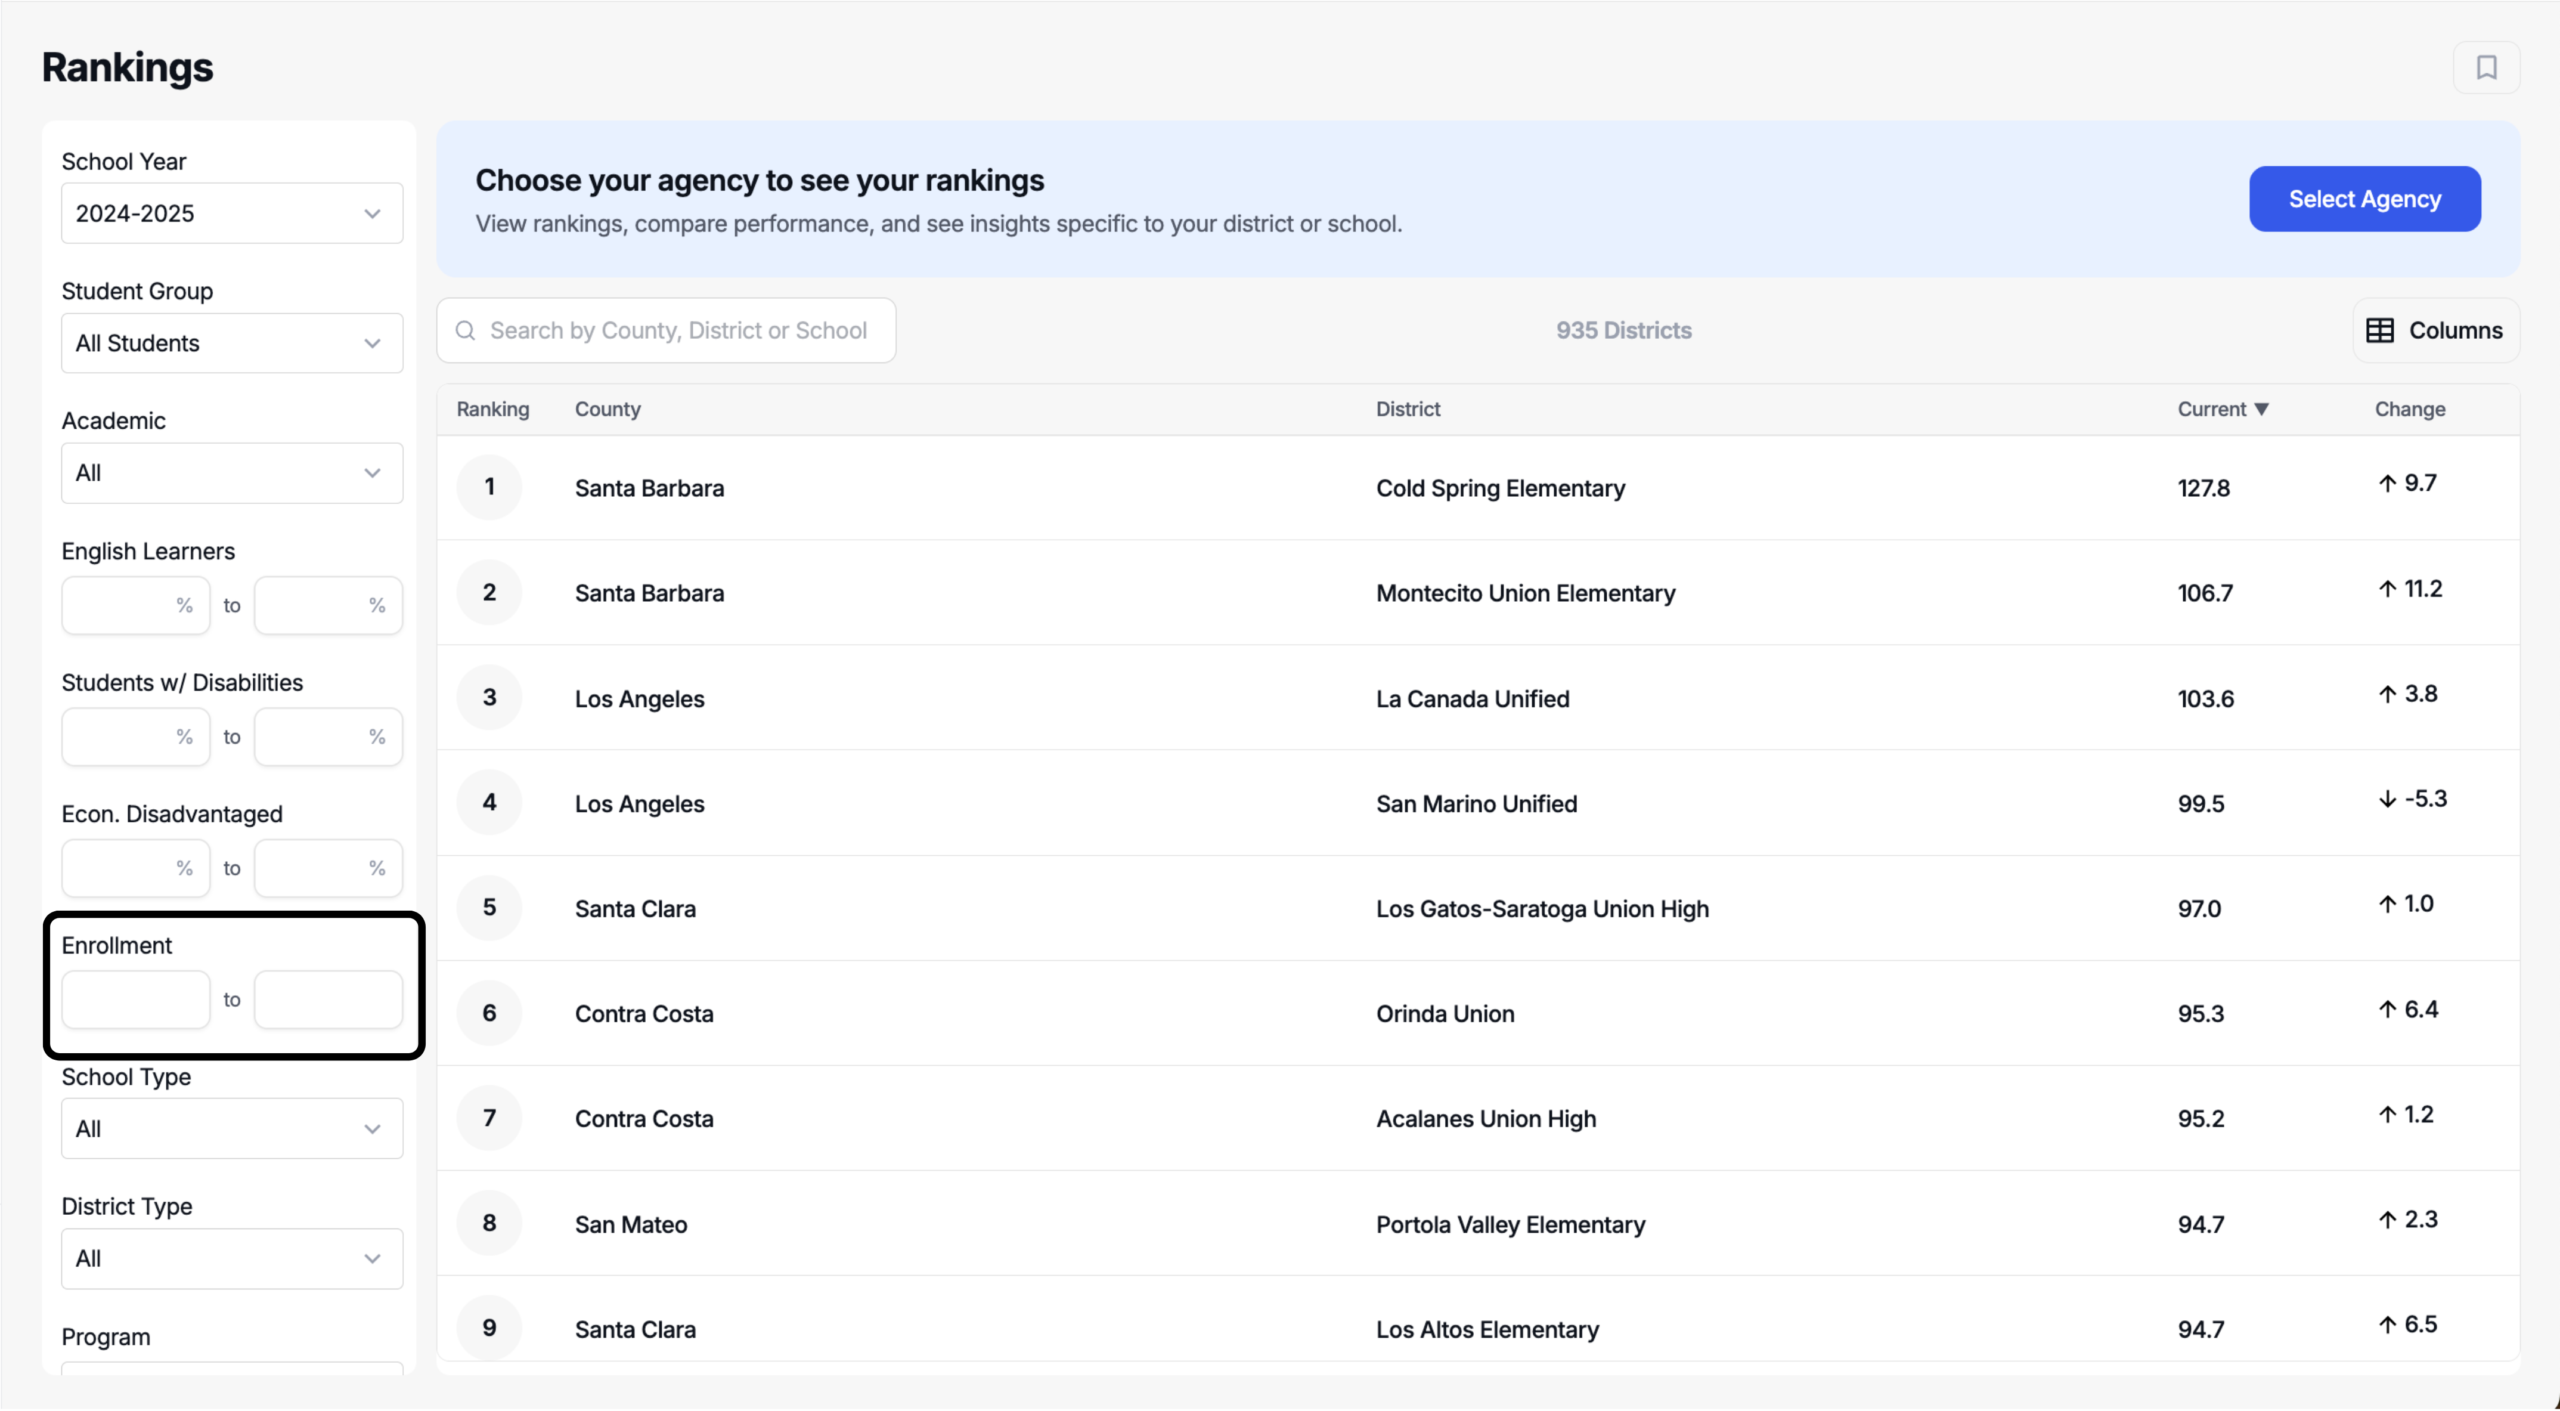
Blank boxes: If one side of a range is blank, that side is open (not zero). If both sides are blank, the filter is simply ignored.
Match the system type
Type matters as much as demographics:
- District type — match yours. A unified, an elementary, and a high school district aren't comparable. (Not perfect — some high school districts serve 7–12, others 9–12 — but far closer.) Example: Kings Canyon Joint is unified, so filter to unified districts.
- School-level filters — if you're comparing schools, use grade served, program (schools, charters, magnets, or any mix), virtual level, and the DAS flag if you're a DAS school
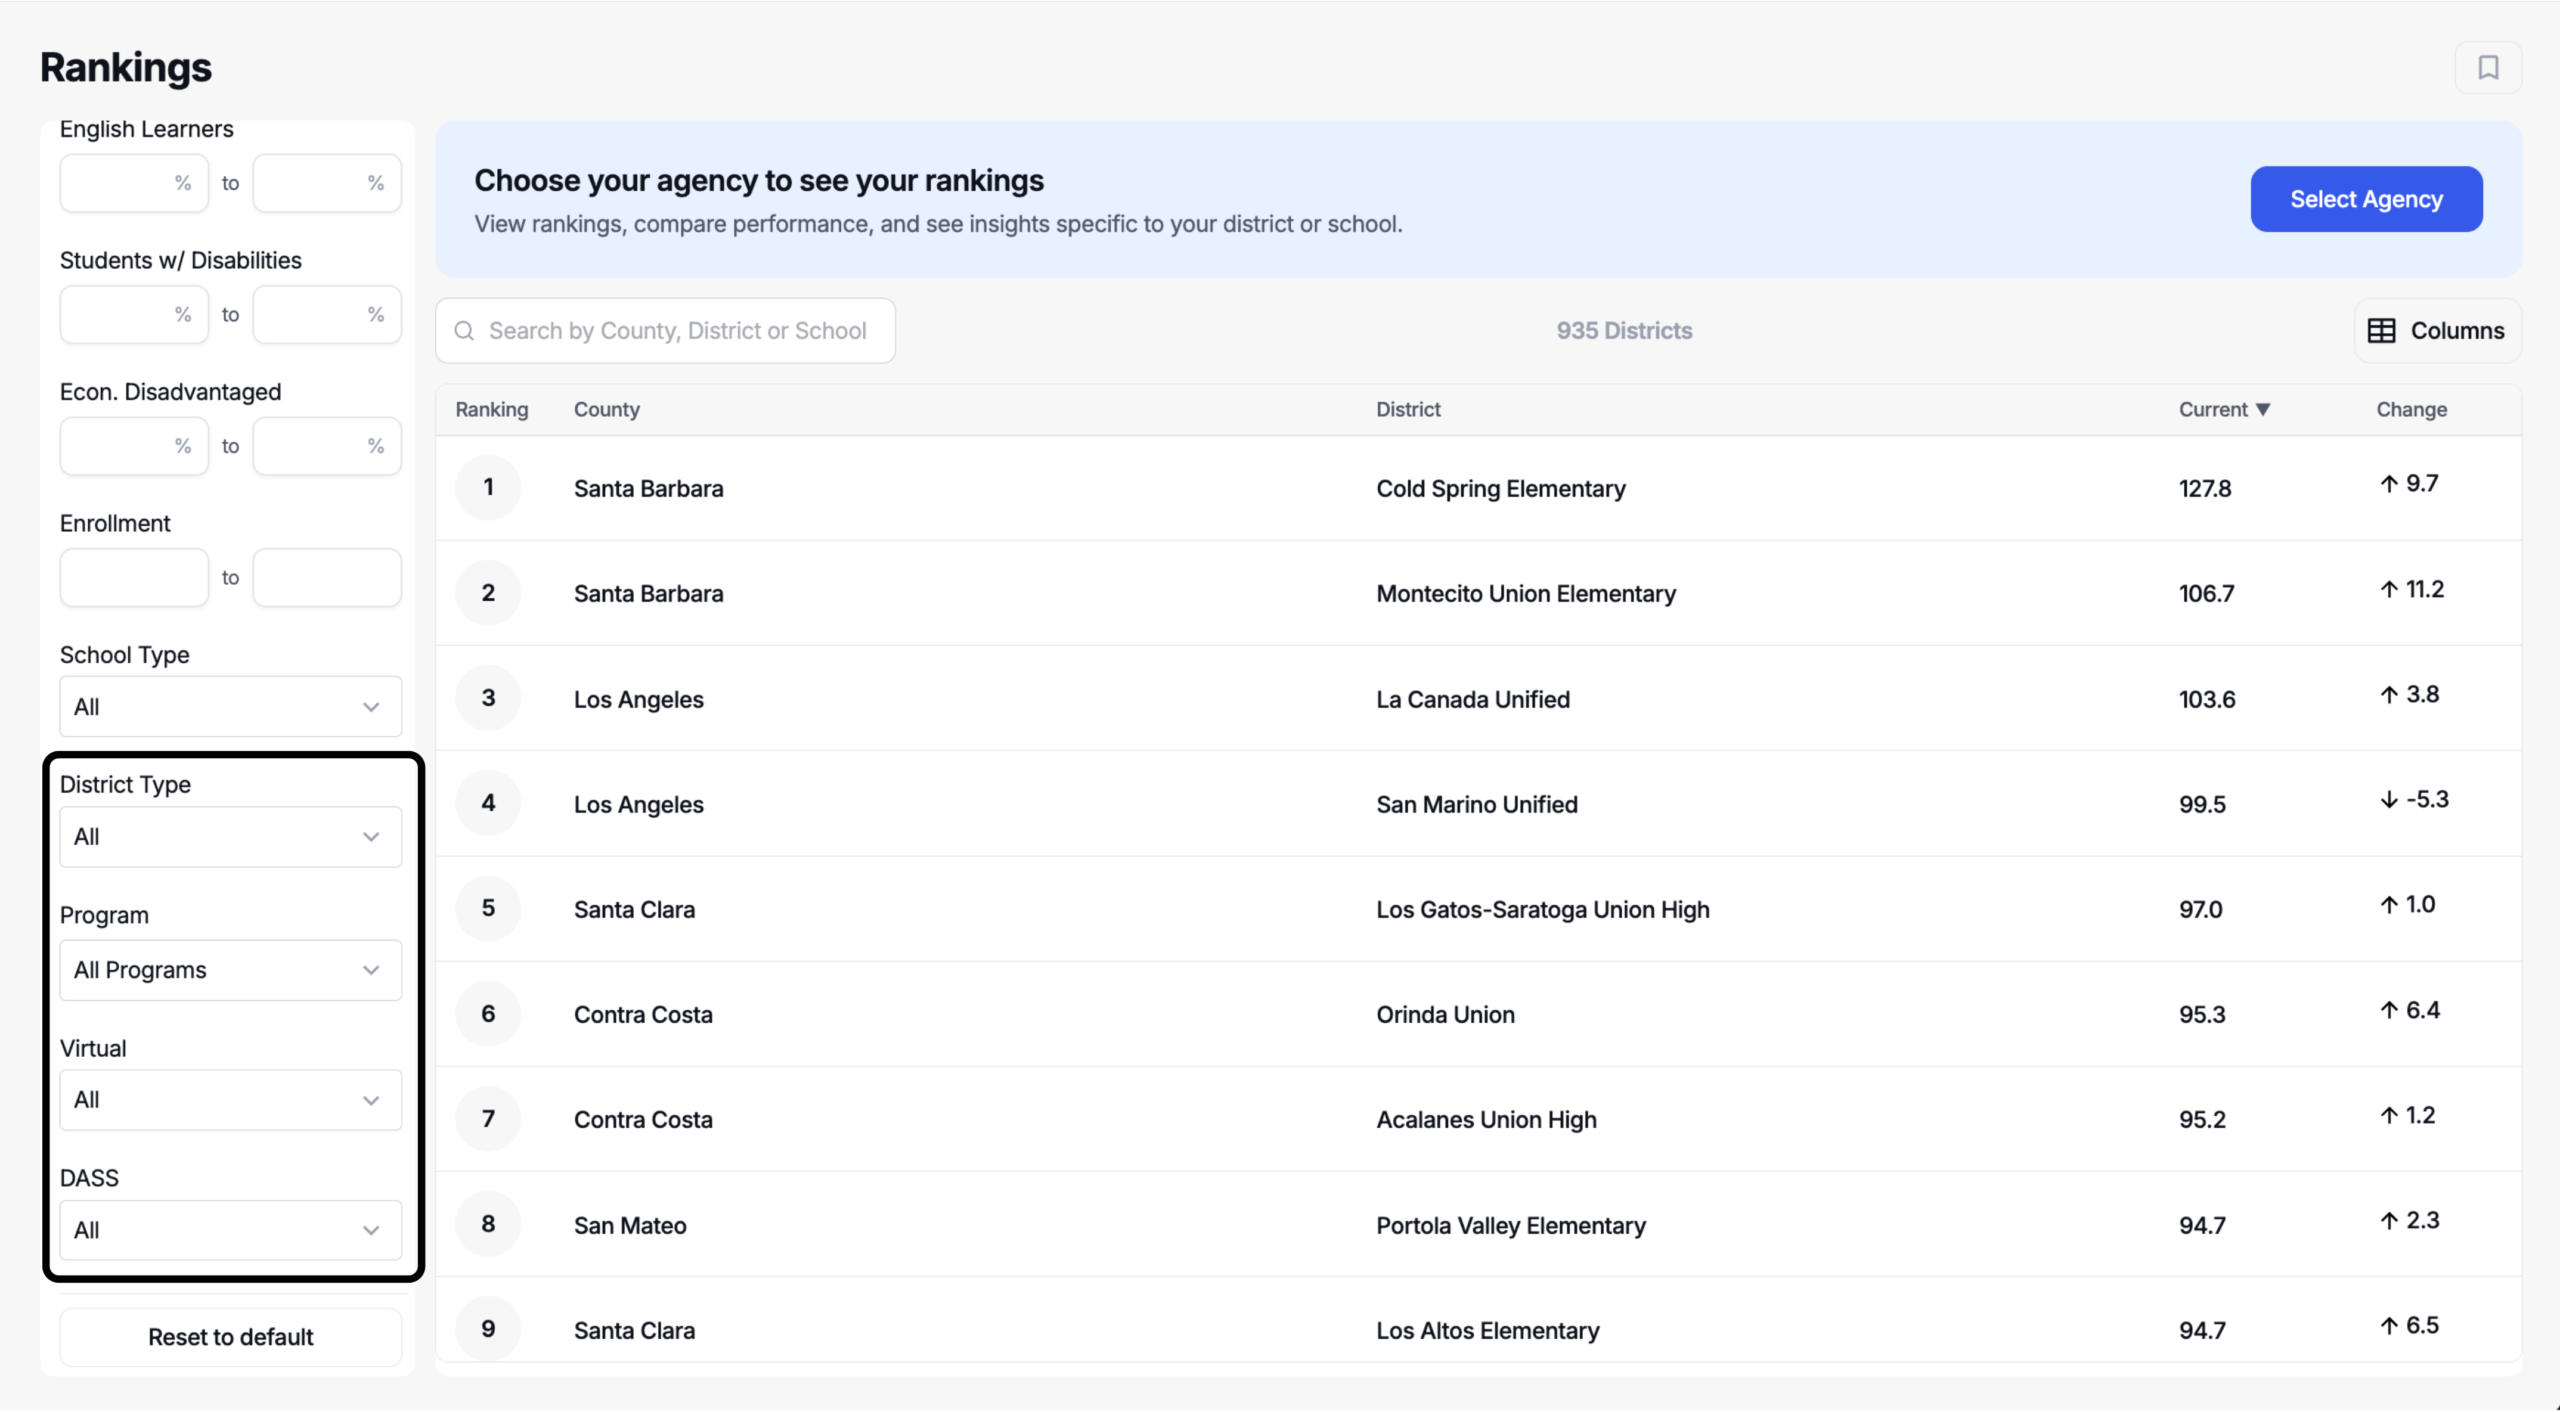
Aim for a workable peer group
You're looking for 10–20 similar systems. Sometimes you'll only get five or six — that's fine. The goal is genuine similarity, and ideally a peer who's outperforming you and worth studying.
If the list is too big, tighten a parameter; too small, loosen one.
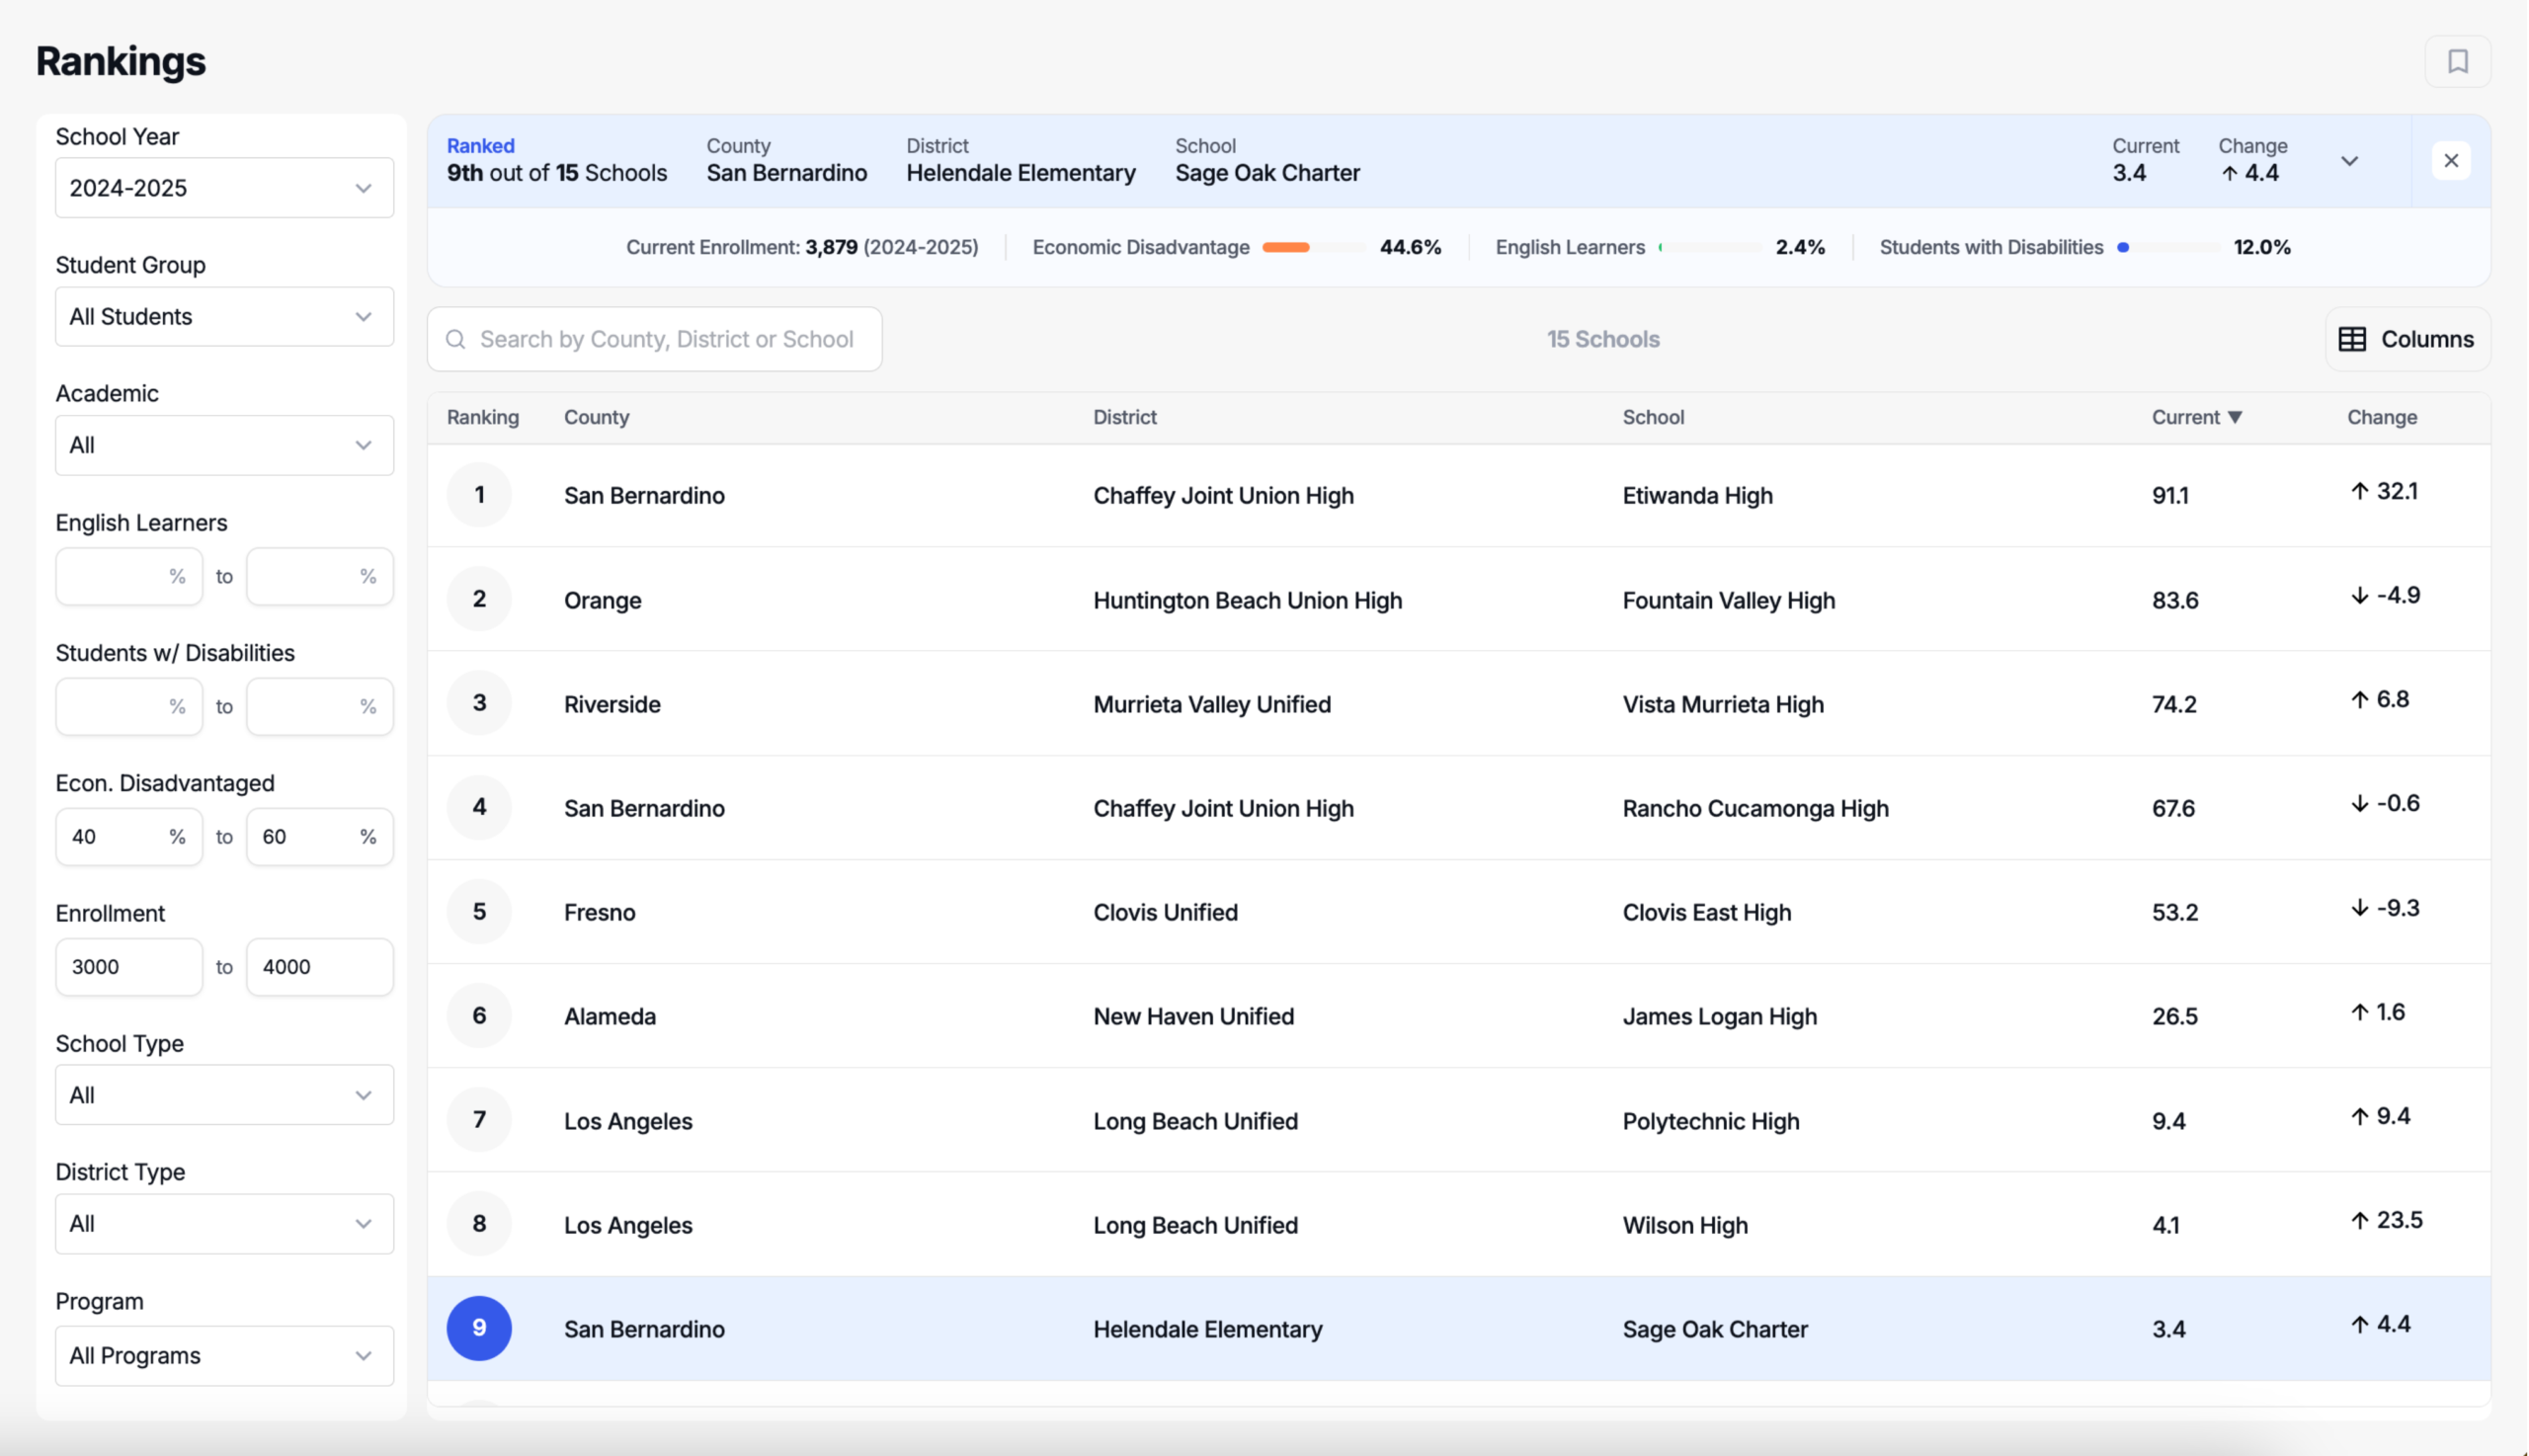
There are no hard rules here. "Close" is what matters. Set the parameters to what you judge is fair, and reset to default anytime you want to start fresh.
Was this article helpful?
What was missing?