
New Hires Spotlight: Meet Misun & Andres
Our team has been so excited to welcome on two talented, kind, and all-around awesome data analyst interns. In today's New Hires Spotlight, we are introducing Misun and Andres. ...
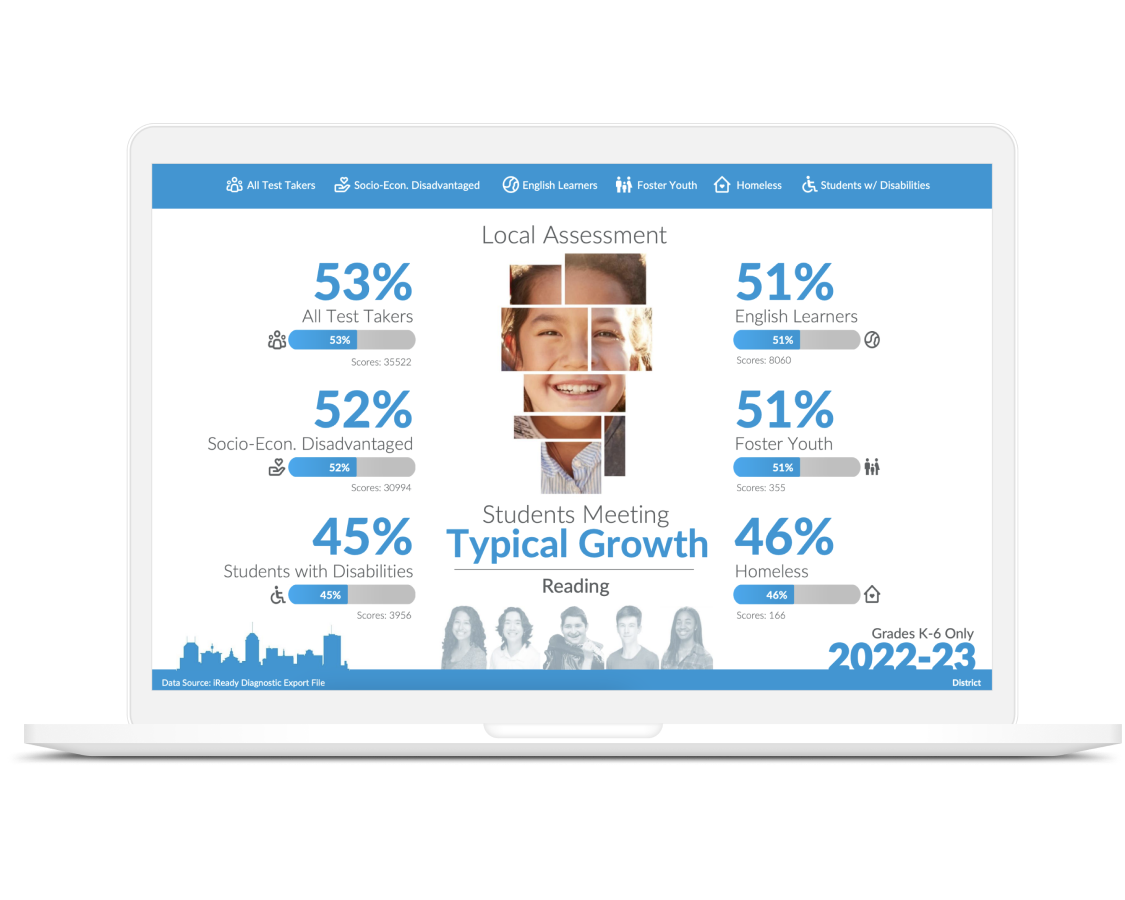
Analytics
Data Analysis for Everyone
Track and visualize state and local level data easily with ready-made reports
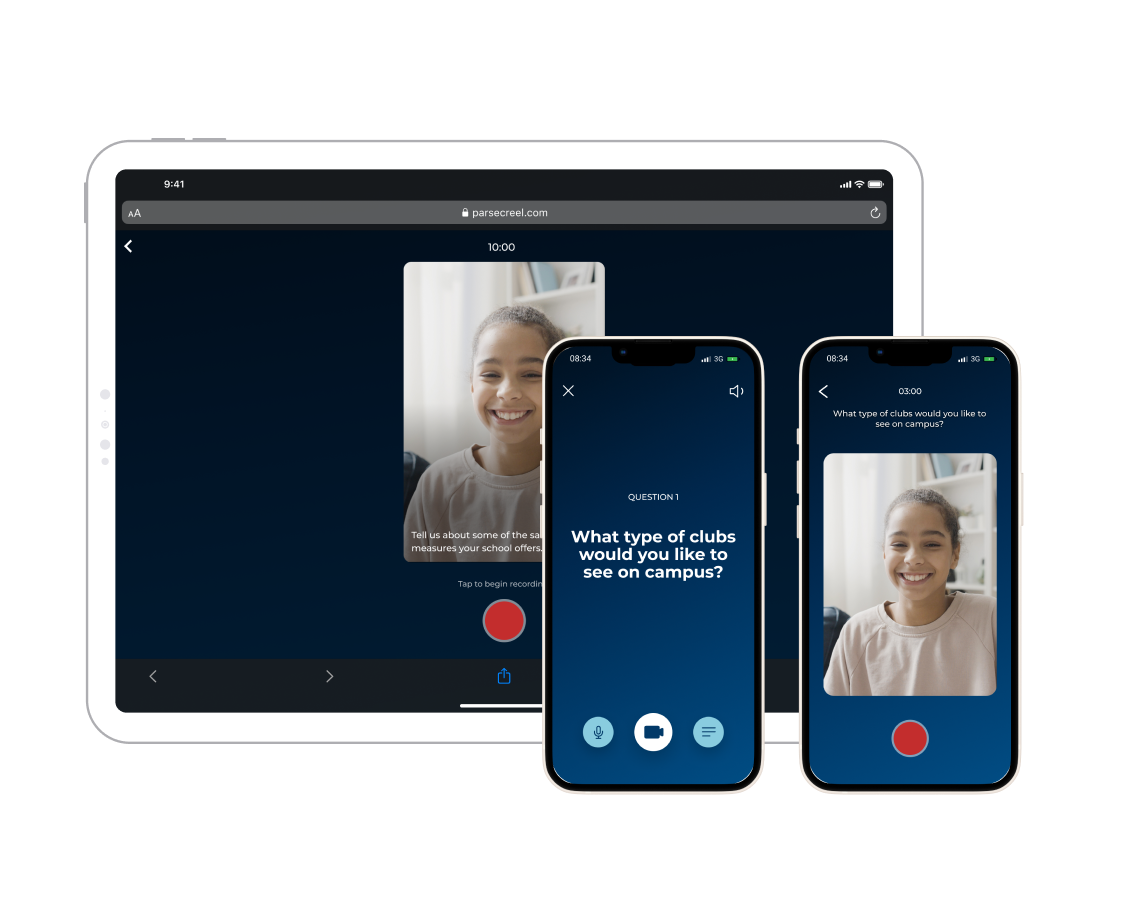
Real
The Qualitative Feedback Solution
Capture authentic feedback leveraging AI for immediate synthesis
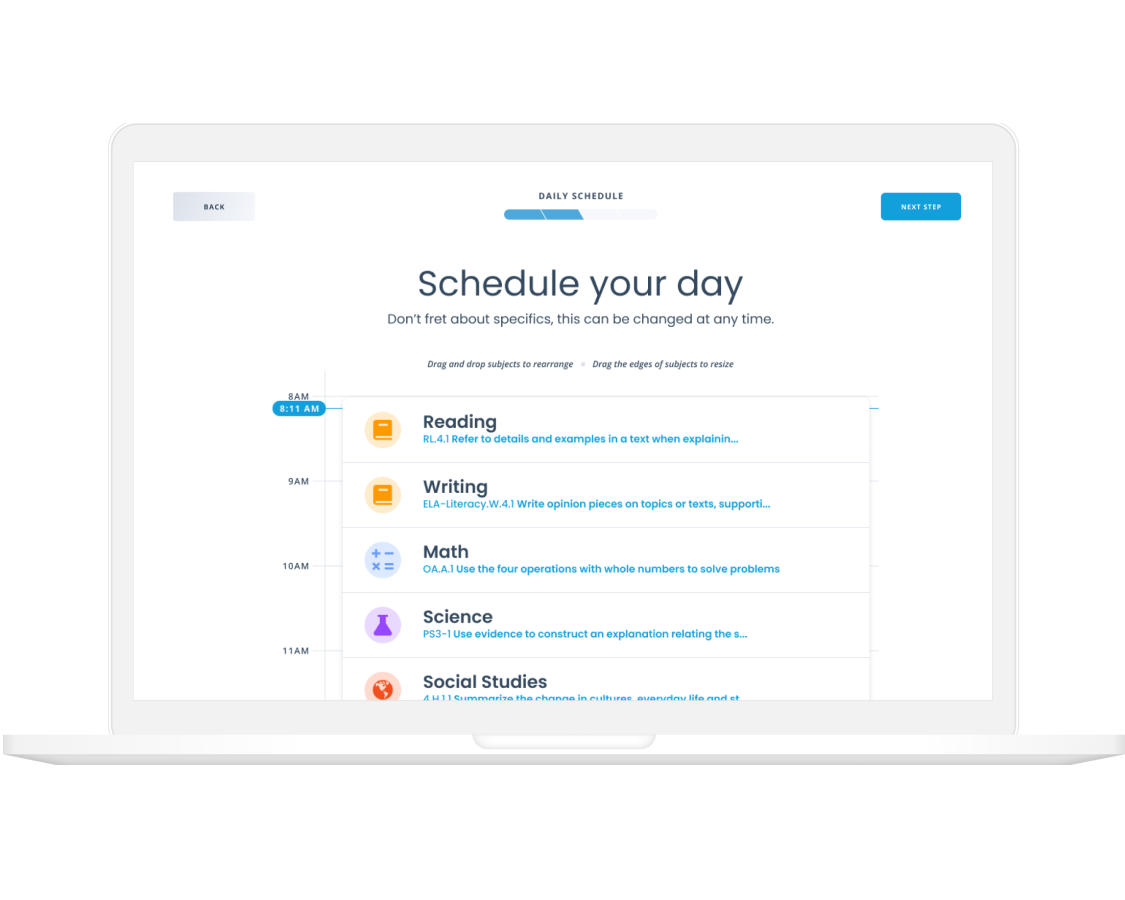
Academy
Teacher Planning Simplified
Amplify your PLCs & lesson planning with tools designed for teachers
600,000+
Students Impacted
300+
Schools Partnered With Us
1,000,000+
Data Points Analyzed


Kings County Office of Education“Parsec Education services have helped our COE have more vibrant data analysis sessions with districts eligible for technical assistance.”
Hope Elementary School District“We went from not having any data to having all the data at our fingertips. Parsec has been very responsive to all of my needs as we work to propel student achievement.”
Pacific Charter Institute“So far, Parsec has been the best program we've used for pulling multiple data sets, and visualizations.”
Innovative Education Management“Parsec provided the timely and thorough data that we need to inform schoolwide decisions as well as data for WASC, LCAP, district, and council reports.”
Sherman Thomas Charter School"One of the most valuable aspects of working with Parsec Education was their commitment to understanding our school community's diverse needs."
Los Gatos-Saratoga Union High School District“We heard incredible feedback from our in-person interviews that took place in the Spring to gather stakeholder feedback. Students requested that we continue with that style of student feedback in the future. (Whatever you did was magical.)”
Shasta Charter Academy“Parsec has given us the ability to effortlessly share data with stakeholders which increases clarity in crafting education innovations to increase student achievement.”















Our team has been so excited to welcome on two talented, kind, and all-around awesome data analyst interns. In today's New Hires Spotlight, we are introducing Misun and Andres. ...
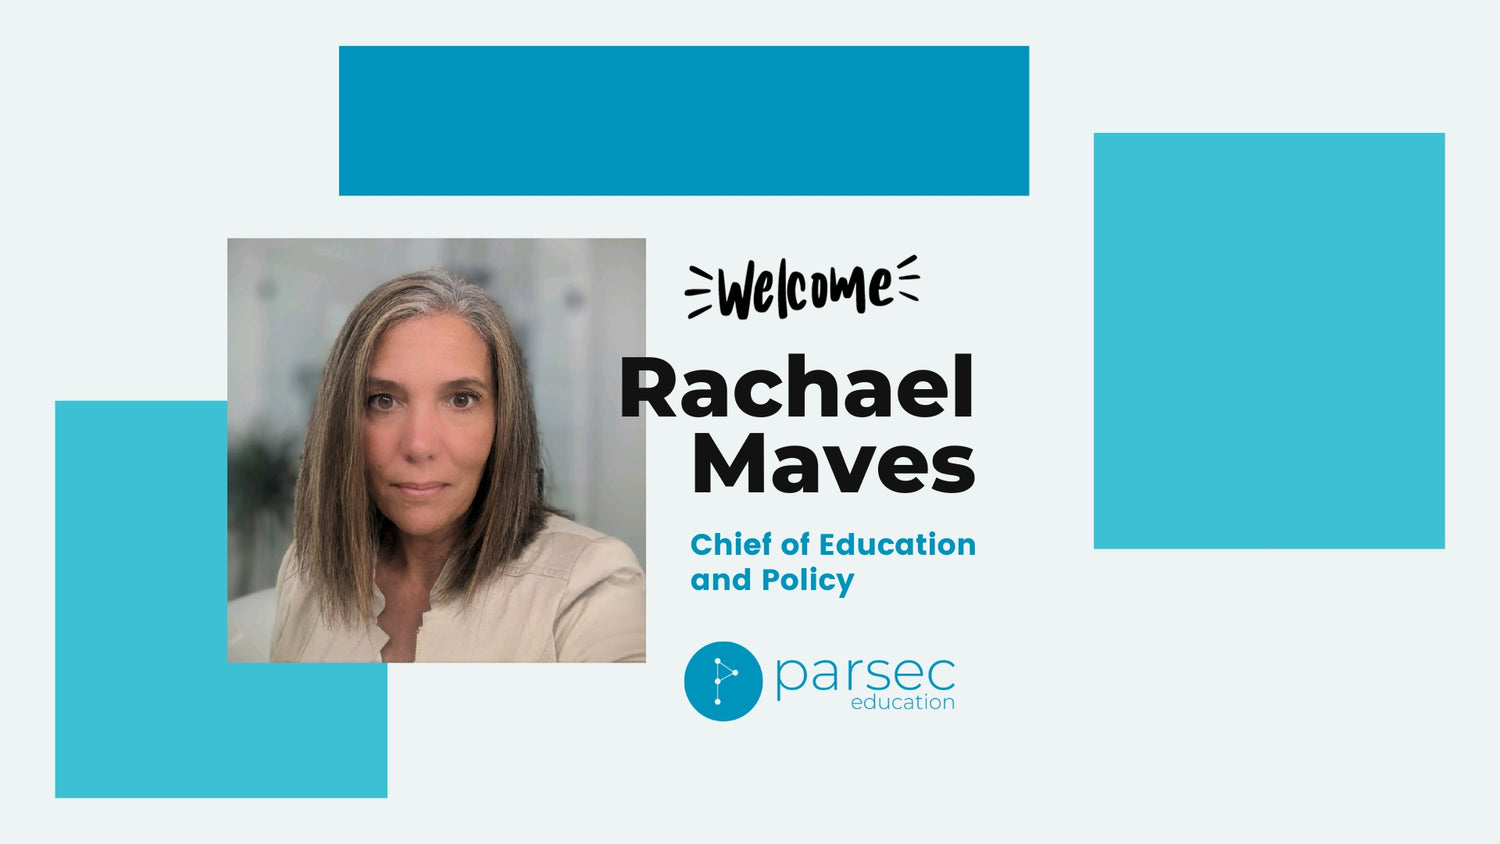
November 6, 2023 – Parsec Education, a leader in educational technology and consulting committed to enhancing K-12 education and student outcomes, is excited to announce the appointment of Rachael Maves...

It's an exciting time at Parsec Education as we continue our journey to improve and transform education. Our commitment to our partners and students would be impossible without our incredible...
SUBSCRIBE
Subscribe for events and product updates.
Newsletter