
This is a title
Navigating Rankings in Parsec Clarity for CA Partners
Watch the tutorial
Why this matters
Comparing your district or school against similar peers used to mean digging through the public research file dashboards, clicking and pulling data by hand. Rankings pulls that into its own dedicated tool, so you can identify similar districts or schools and see how you stack up in just a few clicks.
Who it's for
- District and school administrators who want to benchmark against similar peers
- No prior experience with the platform is required
Step-by-step
Open Rankings and maximize your view
Click Rankings in the left-hand navigation. If you want more screen space, click the three-line icon in the top-left corner to collapse the navigation pane.
Understand the default view
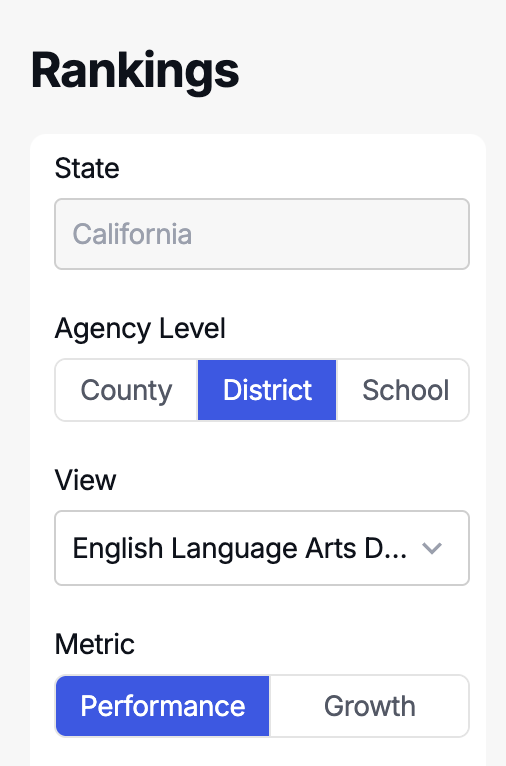
Rankings defaults to the district agency level and to English Language Arts Distance from Standard as the metric. You can add more data points to the list, such as enrollment or low-income percent, alongside the selected metric.
Select the agency you want to rank
Click Select Agency and choose the district (or school) you want to look at — for example, Kings Canyon Joint. Once selected, you'll automatically see:
- Where that district ranks among the California districts producing a score for the selected metric
- County and district name
- Current value for the metric and change from the previous year
- Enrollment size and student group percentages
- A trend view of that metric over time, available by clicking the down caret
Changing the metric — for example, switching to Math Distance from Standard — refreshes all of this automatically.

Choose the agency level: county, district, or school
You can view rankings at the county, district, or school level. Keep in mind:
- If you select school without choosing a specific school first, the results will be blank
- If you select county, you'll still see district-level detail rolled up to the county
- Switching back to district restores the agency you originally selected
Pick your metric and view
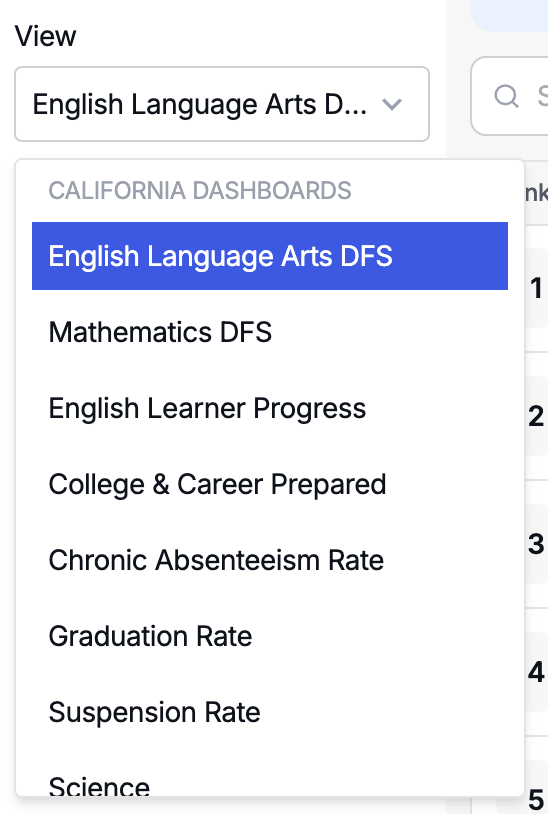
Choose the metric you want to rank by — either from the California School Dashboard or from assessment proficiency data with no business rules applied. For California School Dashboard metrics like ELA and Math, you can view by growth, growth points, or performance, and by year.
Student group filters that are purely academic (like the distinction between ELA and graduation rate) are automatically excluded here, since they're already tied to the metric you selected.
Narrow results using demographic filters
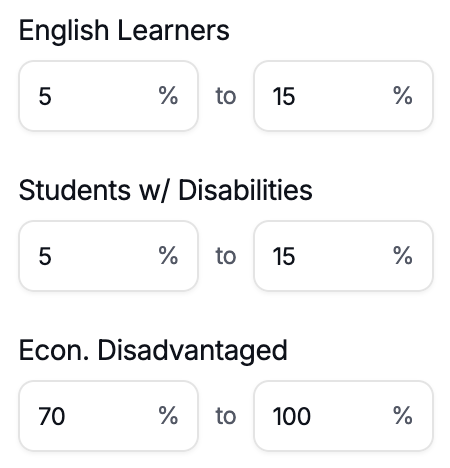
Use the fill-in-the-blank demographic filters — for example, percent English Learner or percent Economically Disadvantaged — to find districts with similar demographics to your own. You don't need to fill in every field; leaving one side blank tells the tool to include everything above or below your entry.
Filter by enrollment size and district type
Set an enrollment range to compare against districts of a similar size, and filter by district type (Unified, Elementary, High School) to narrow further to districts structured like your own.
Use school-level filters (when viewing at the school level)
At the school level, additional filters become available, including program type (charter, magnet), DAS school status, and level of virtual options offered.
Reset to start over
Click Reset to Default at any time to clear your filters and start again.
If you have questions, reach out to your Learning Integration Specialist — they're happy to walk through this with you.
Was this article helpful?
What was missing?