
This is a title
How to use the Federal Accountability Report in Clarity Lite
Why this matters
Every year, Tennessee's accountability system produces a set of rankings — Priority and Focus school designations, letter grades, spending reports. For most leaders, those labels arrive each fall and feel like something done to them rather than something they can use.
The Federal Accountability report in Clarity Lite flips that. Instead of waiting for a designation, you can work with the same underlying data all year long — filtered to schools that actually look like yours — to ask better questions, find peers who've solved problems you're facing, and make sure your resources are going where your students need them most.
Who it's for
This article is for anyone responsible for deciding where people, money, and attention go in a Tennessee school or district:
- Principals and school leaders tracking performance between accountability cycles
- Directors of schools and district administrators making staffing and budget decisions
- Data and accountability staff preparing for board presentations or grant applications
- Central office teams building peer networks and improvement plans
No advanced data skills required — if you can read a filtered table, you can use this report.
Step-by-step
Open the Federal Accountability report
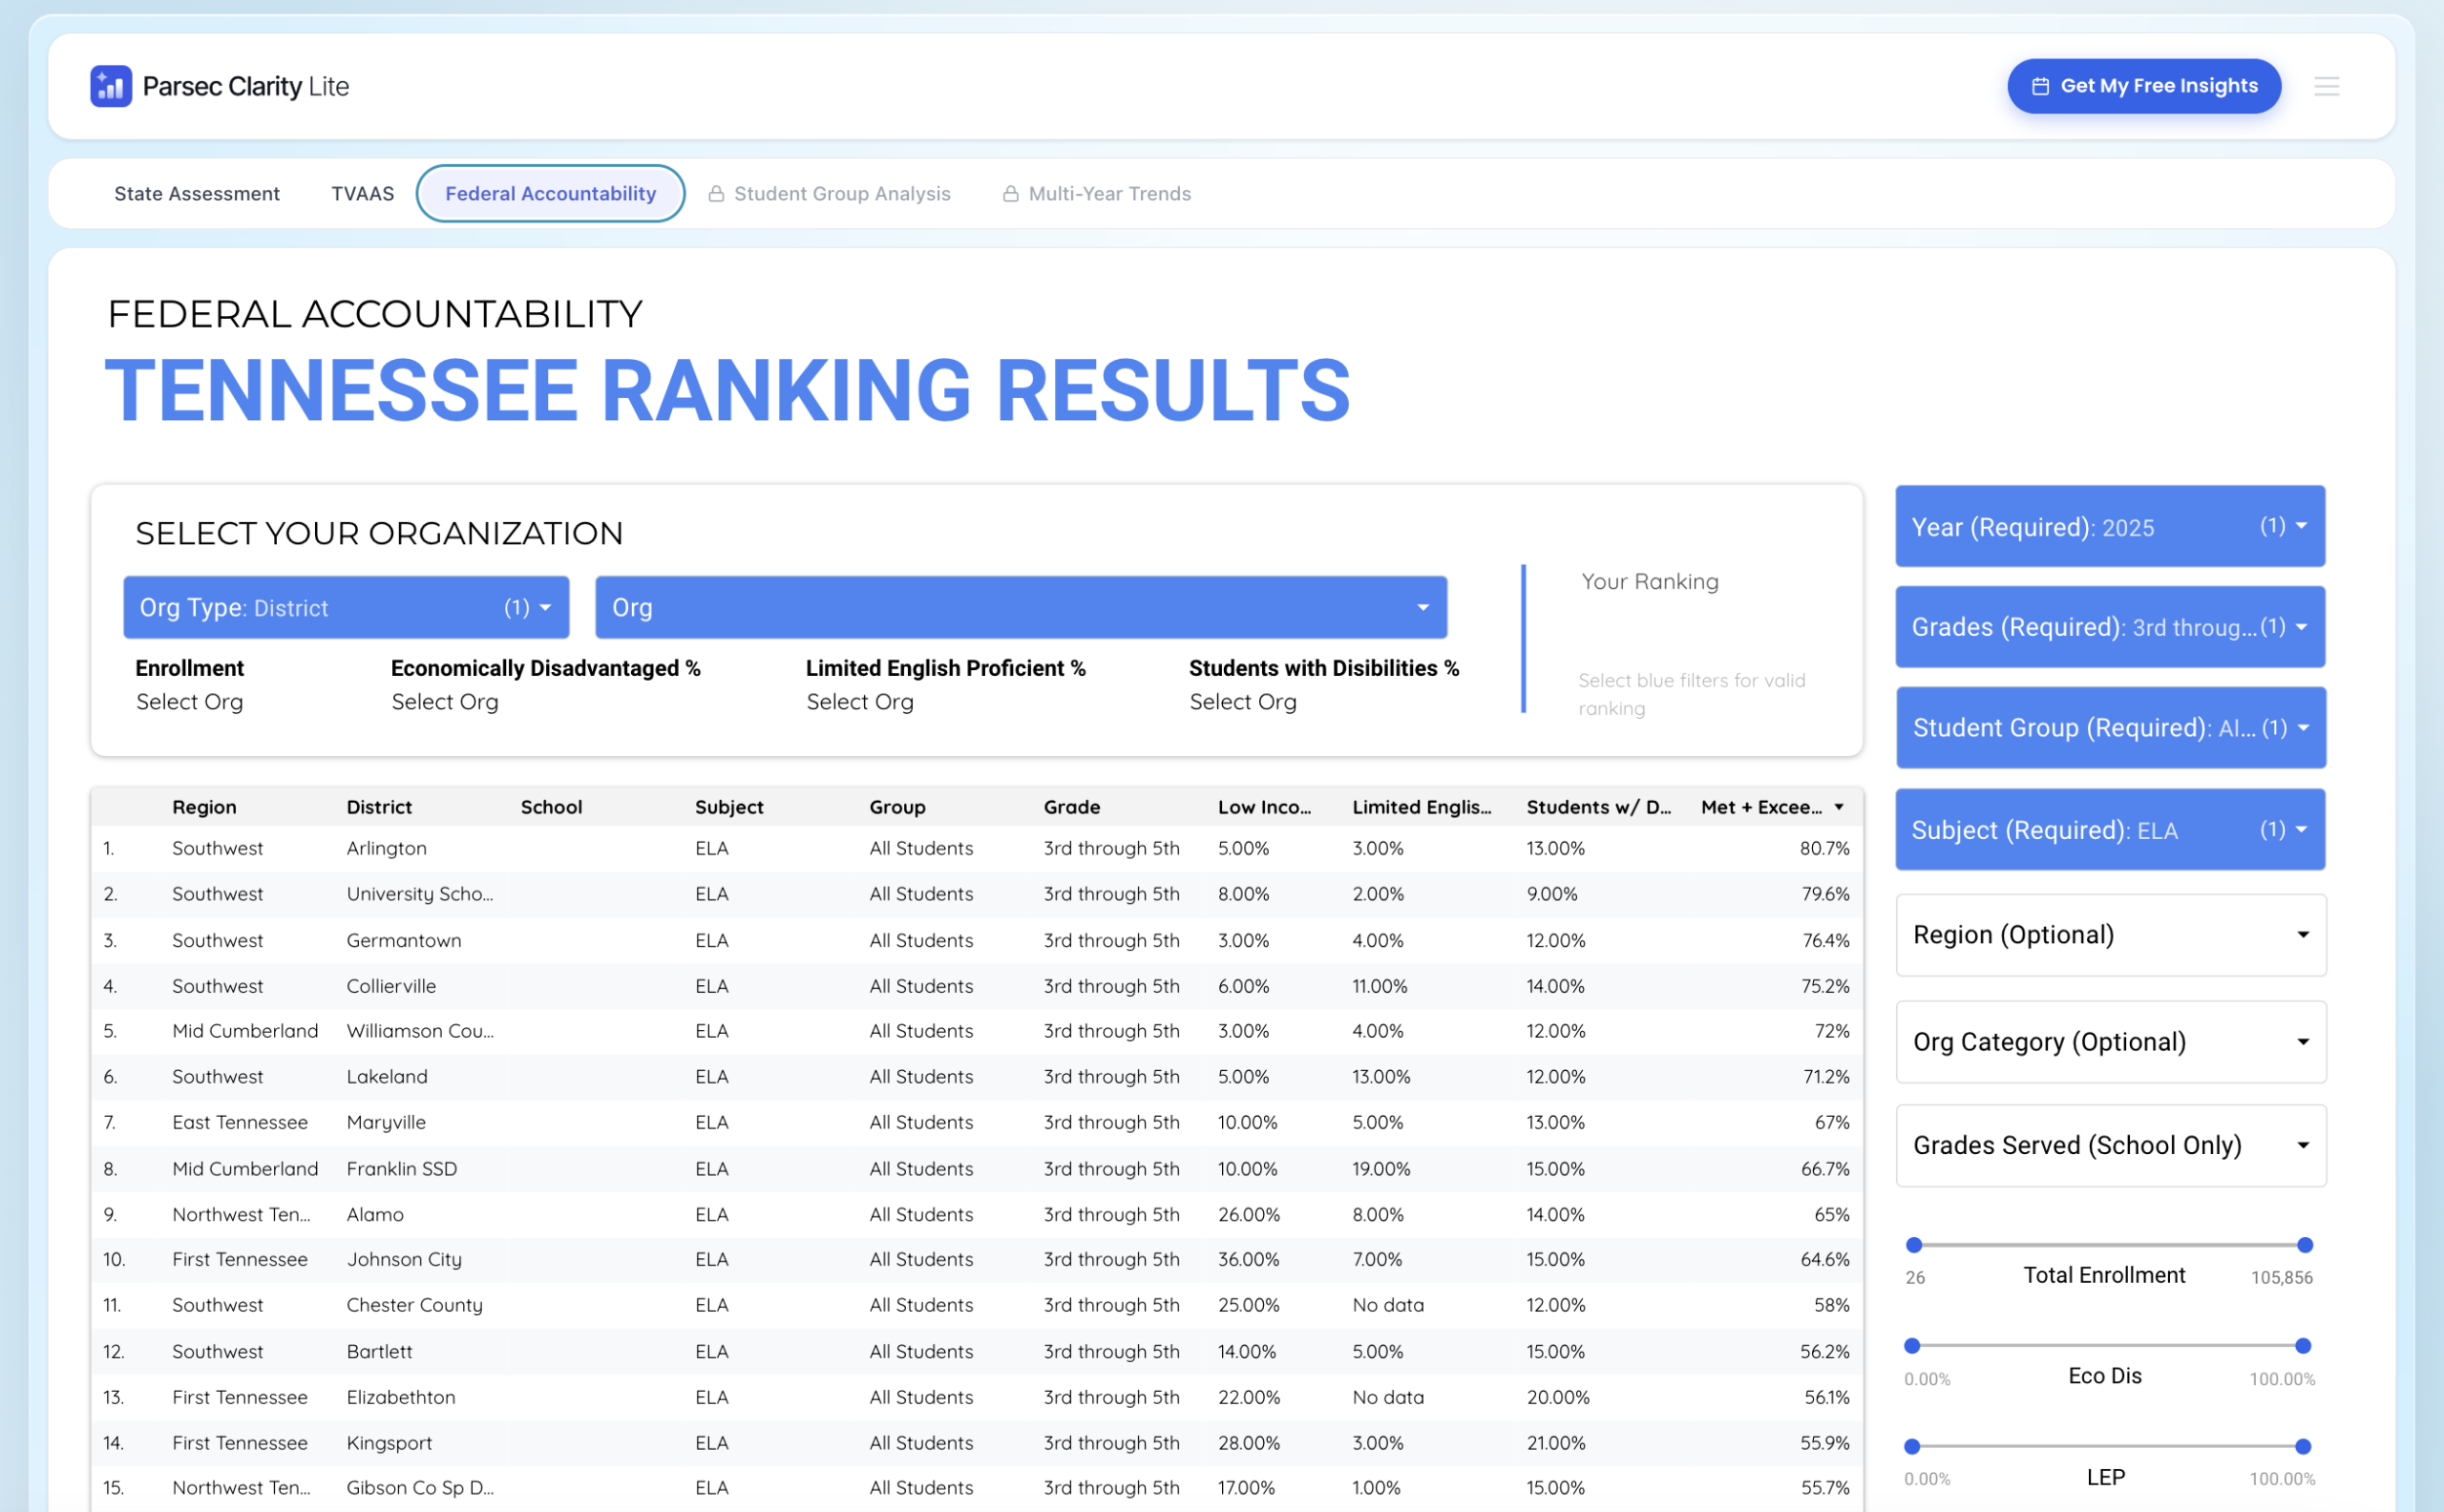
From the Rankings section, click Federal Accountability. This report measures how schools and districts are performing under ESSA — covering student achievement, academic growth, graduation rates, English learner progress, and chronic absenteeism. It's the same framework behind Tennessee's Priority and Focus school designations.
The rankings table will load showing all Tennessee schools by default. Before you read anything, go to Step 2.
Set your filters first
Looking at your school's ranking against the state average isn't a fair comparison. A school serving 90% economically disadvantaged students is operating in a fundamentally different context than one serving 15%.
Always filter your peer group before drawing any conclusions. Use the four demographic filters to define schools that look like yours:
- Total enrollment — match your size
- Economically disadvantaged % — the strongest single predictor of the supports a school community needs
- Limited English proficiency % — signals staffing, translation, and family engagement needs
- Students with disabilities % — shapes special education staffing and inclusion planning
Why percentages and not raw counts? A school serving 120 English learners out of 300 students faces a very different challenge than one serving 120 out of 2,000. Filtering by percentage puts schools of every size on equal footing.
Customize your view
Once your peer group is set, use the view filters to focus on the specific question in front of you.
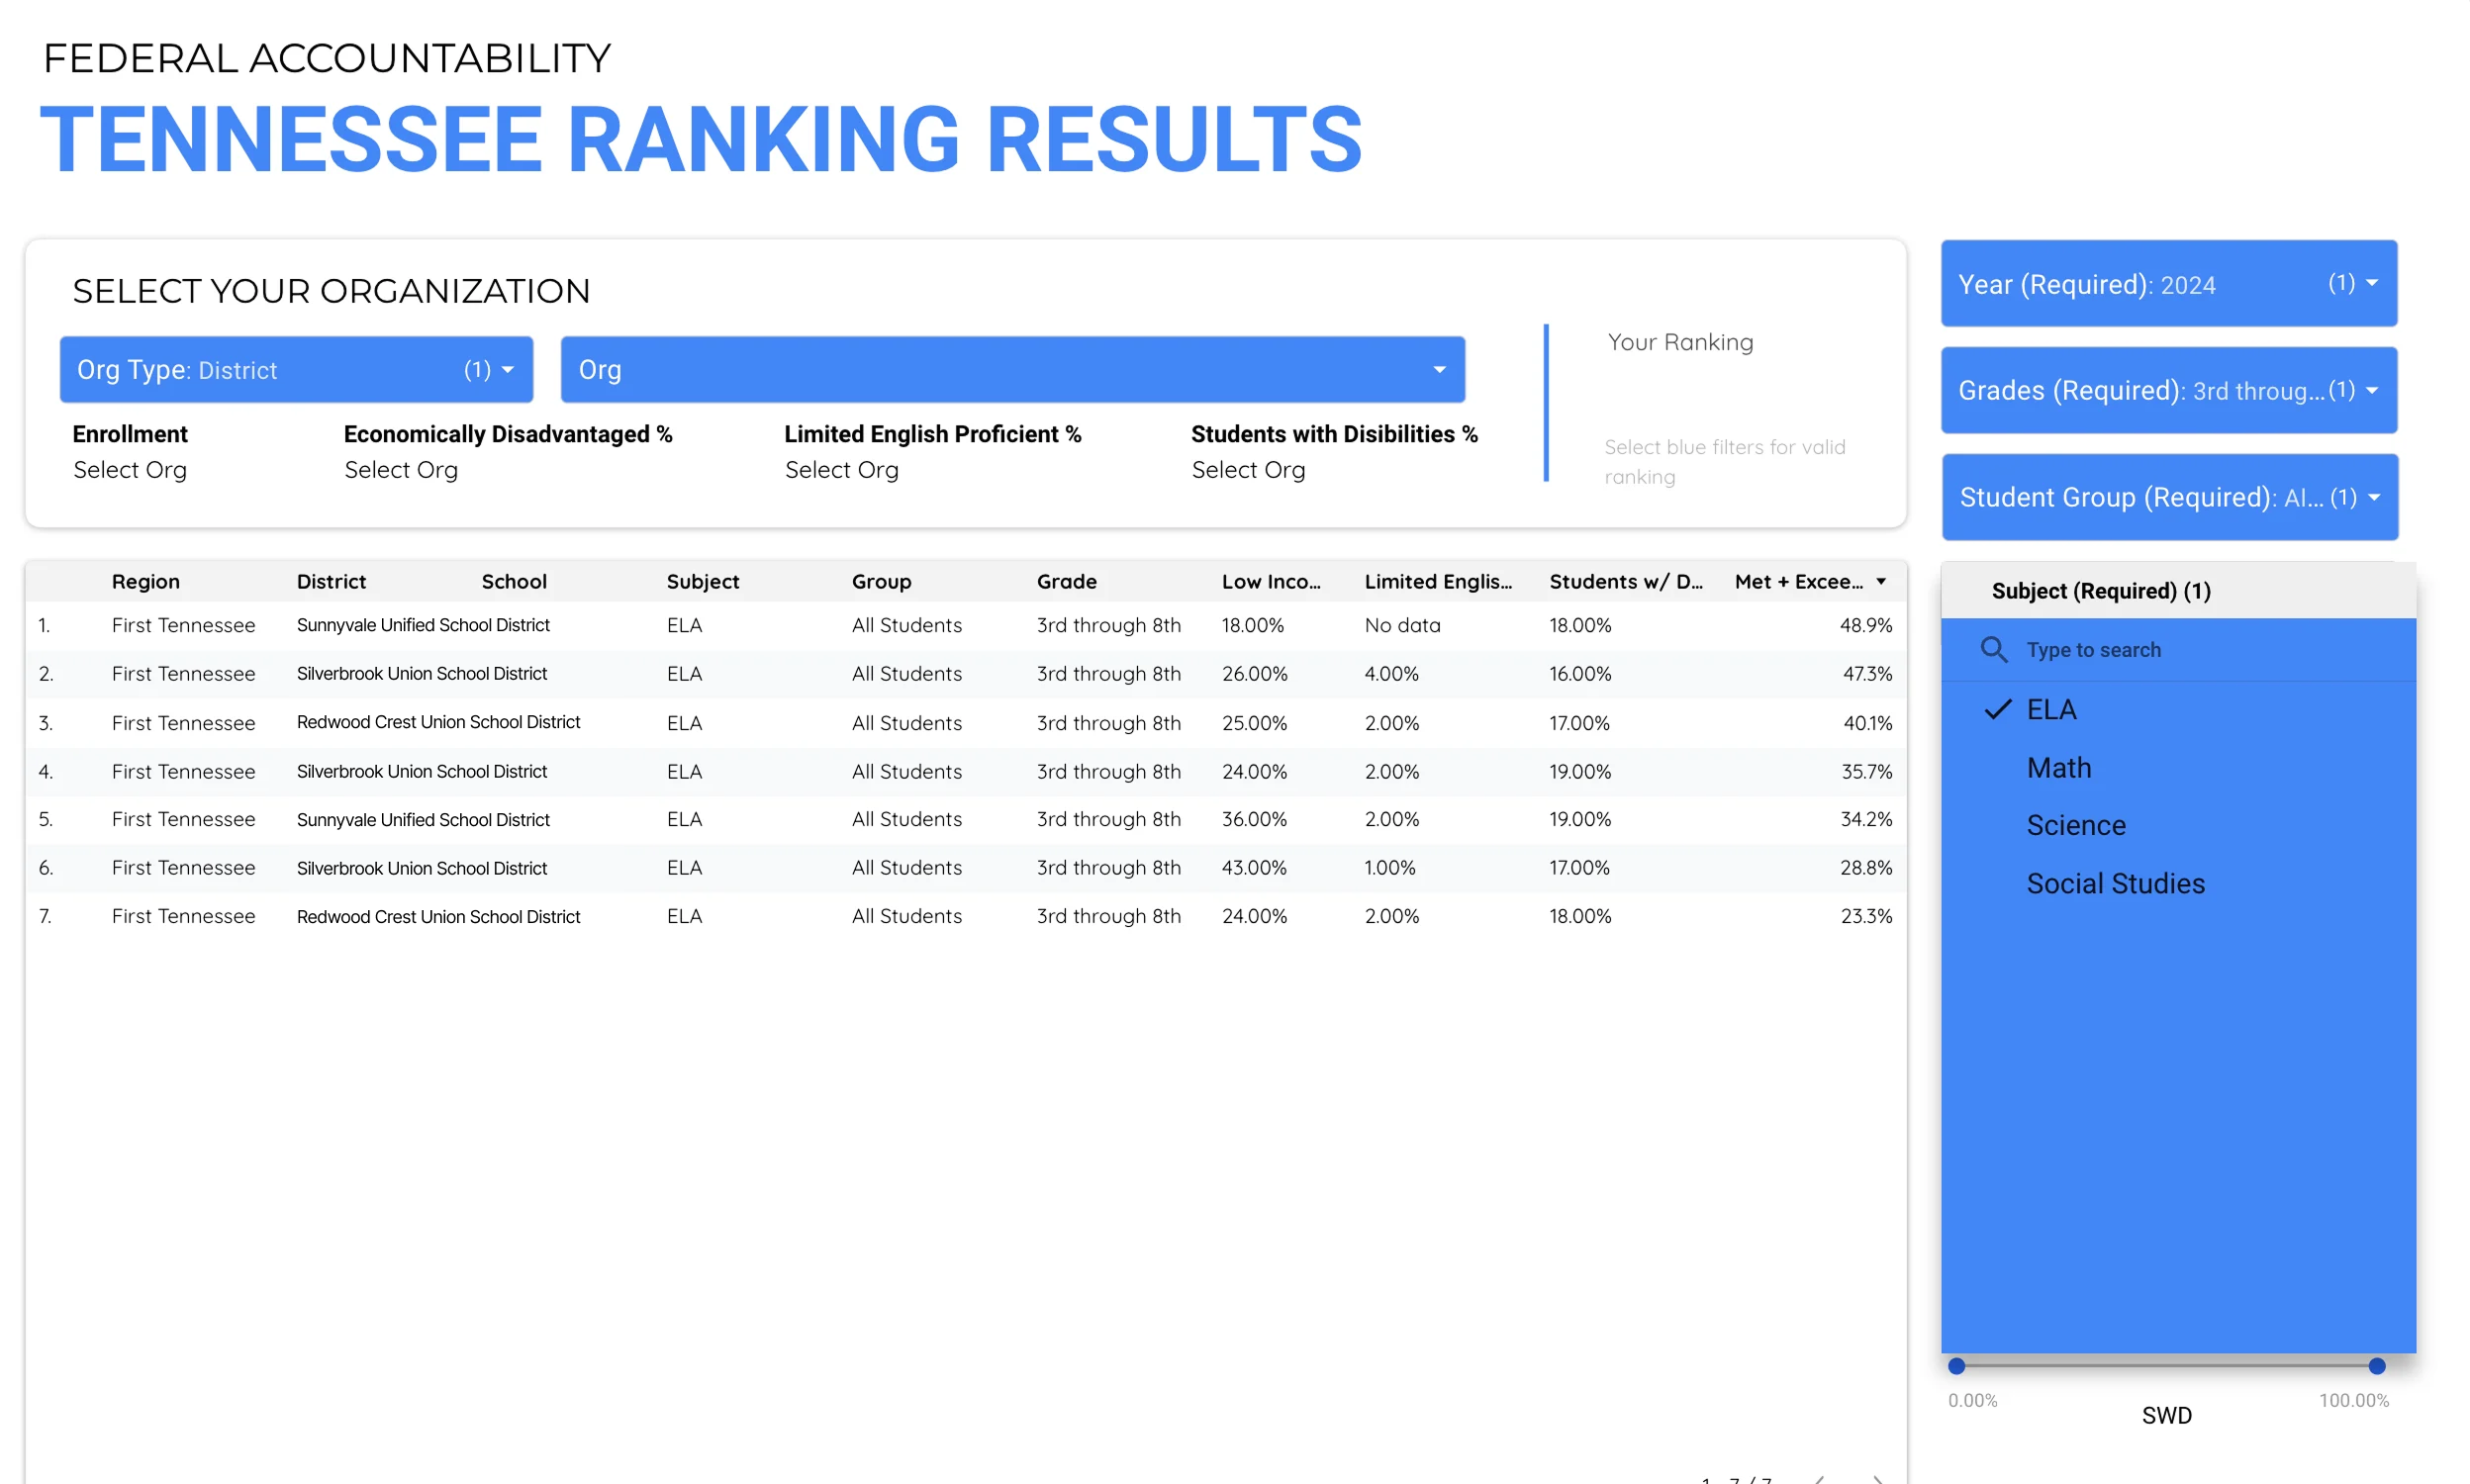
| Filter | When it's useful |
|---|---|
| Grade level | Zeroing in on elementary, middle, or high school performance |
| Subject | Isolating a specific content area — e.g., Grade 3 ELA or Algebra I |
| Student group | Finding schools closing the exact gap your accountability data flags |
| Year | Looking at a single accountability cycle |
| Region | Adding geographic context when relevant |
Tip: The subject and student group filters are especially powerful together. If your accountability designation is driven by math performance among English learners, filtering to both at once shows you exactly which peer schools are outperforming you on that combination.
Read your results with a purpose
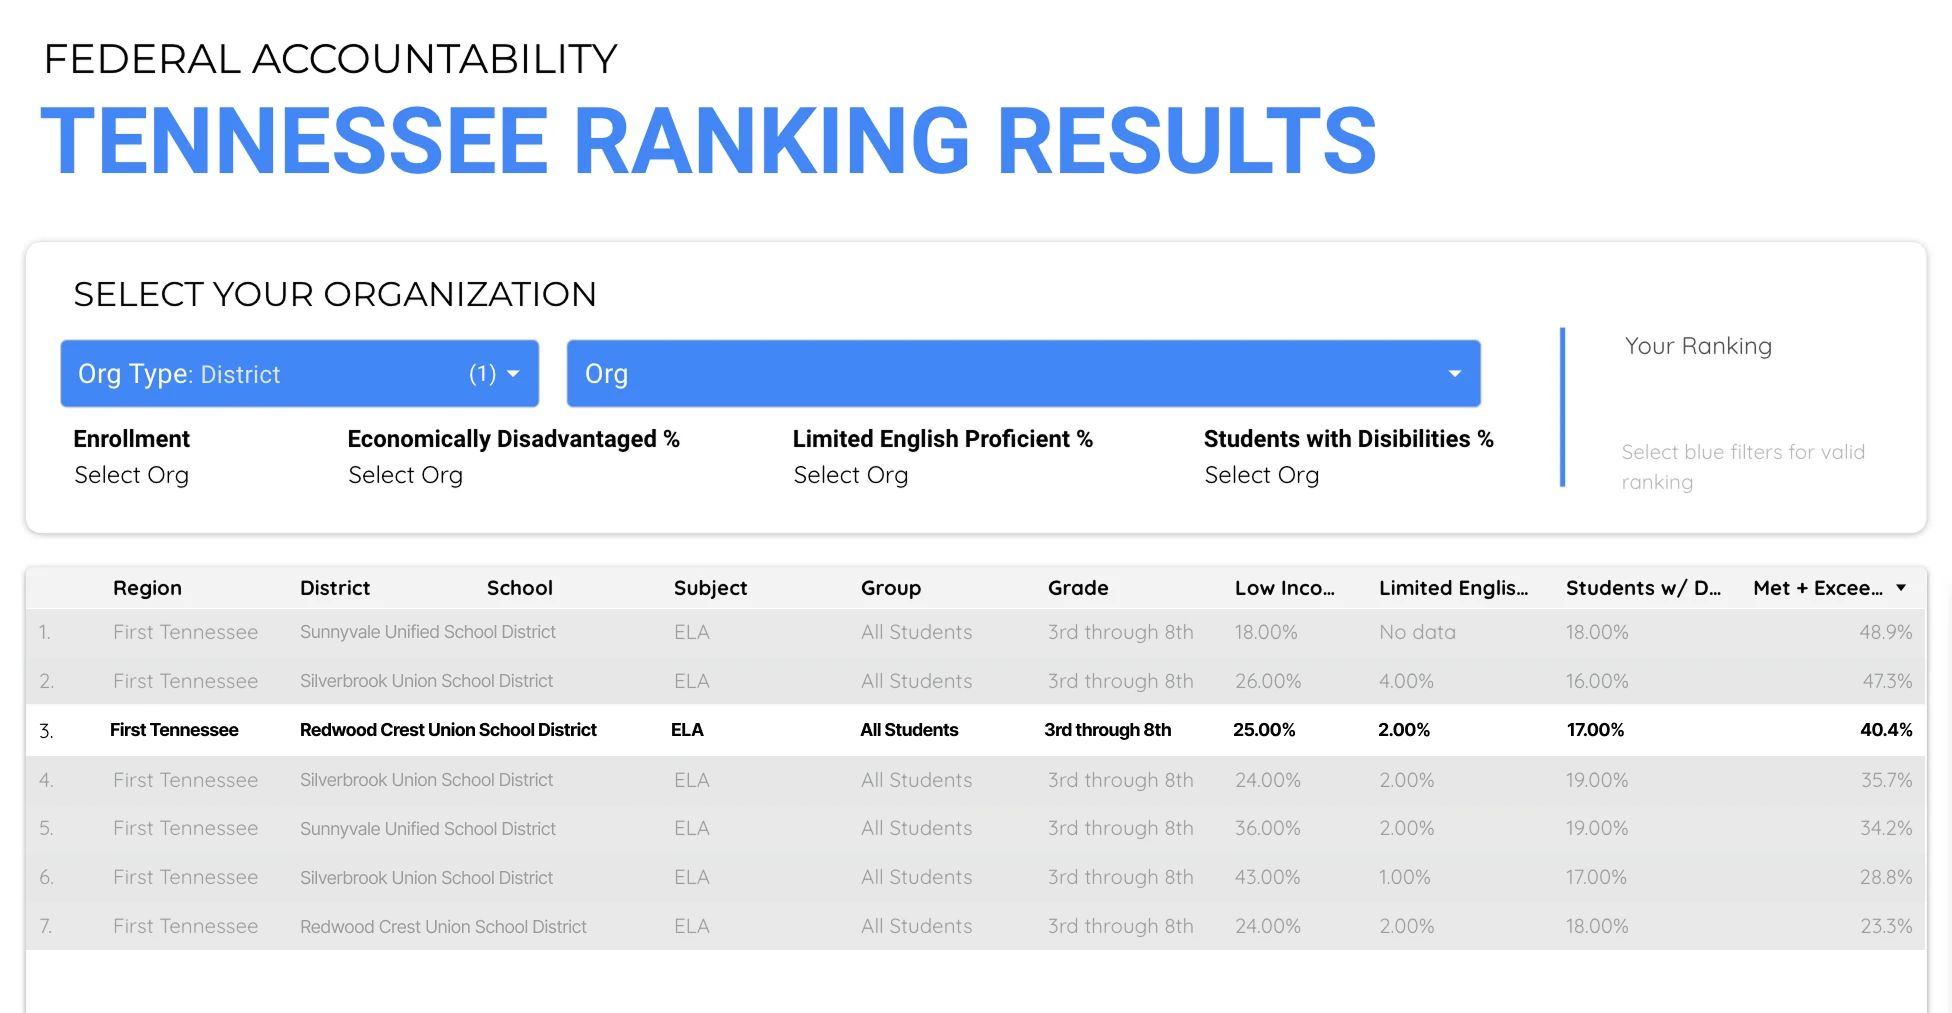
Now that you're looking at a fair peer group, here are four ways to put the table to work:
Find your position honestly. Where do your schools rank among peers with similar demographics and spending? A ranking among true peers is a planning tool. A ranking against the state average is just noise.
Spot resource misalignment. Sort by economically disadvantaged percentage, then look at where your schools land relative to their per-pupil spending. Schools high in need but low in relative spending are your first equity conversation.
Identify beat-the-odds schools. Look for schools near the top of your filtered list — systems posting strong met/exceeded rates despite demographics similar to or harder than yours. These are the schools worth contacting. They've already solved problems under conditions like yours.
Track accountability readiness year-round. Priority and Focus designations shouldn't arrive as surprises. The Federal Accountability report uses the same underlying measures. Check it regularly, not just when new state data drops.
Contact a high-performing peer

Once you've identified a school outperforming yours on a measure you care about, click their name in the rankings table to access the lead administrator's contact information.
One concrete practice learned from a true peer — a school with your demographics, your budget, your challenges — is worth more than a dozen generic strategies. The contact feature exists to make that conversation easy to start.
A note on using rankings responsibly
Rankings are powerful because they're simple — which is also their risk. A few things to keep in mind:
- A ranking starts a conversation — it doesn't end one. A position on a list is a prompt to investigate, not a verdict on a school or its educators.
- Small numbers can be misleading. Subgroup percentages in small schools can shift significantly with just a handful of students. Look for patterns across multiple measures before acting.
- Spending is context, not judgment. Higher per-pupil spending often reflects higher need, smaller school size, or specialized programs. Use it to ask questions about alignment, not to declare winners.
Want to go deeper than one year of data?
The Federal Accountability report shows you where your schools stand right now. But if you want to know whether a high-performing peer has been improving consistently — or whether last year was an outlier — that requires multi-year data.
Multi-Year Trends and Subgroup Analysis are both available in the Clarity platform, built specifically for the questions that come after you've found your peer group and started asking why.
Want to see what's possible with the Clarity platform?
Talk with our teamWas this article helpful?
What was missing?