
This is a title
The Clarity Rankings Team Reflection Protocol
Why this matters
Looking at data alone rarely leads to action. What moves the needle is a team sitting down together, asking the same questions, and walking out with clear owners and next steps.
This protocol gives your leadership team a repeatable structure for doing exactly that — ideally every time new state data is released. It takes about an hour and works whether you're a two-person school leadership team or a full district cabinet.
Who it's for
Any Tennessee school or district leadership team that wants to move from looking at accountability data to acting on it. That includes:
- School leadership teams preparing for improvement planning conversations
- District cabinet and central office teams doing quarterly or annual data reviews
- Directors of schools facilitating cross-site learning with their principals
- Instructional coaches and data leads supporting site-level reflection
Step-by-step
What you'll need
- Access to Clarity Rankings
- A shared screen or printed screenshots of your filtered rankings
- 60 minutes with your leadership team
- A notetaker to capture decisions and owners
Tip: Run this protocol with your filters already set before the meeting starts. Load the Federal Accountability report, apply your peer group filters, and have the table ready to go. The conversation will be richer if the team is reacting to data, not waiting for it to load.
Locate 10 min
Where do our schools rank on the measure most tied to our improvement plan?
Pull up the Clarity Rankings table filtered to your peer group. Find your school or district in the results. Don't react yet — just locate yourselves accurately.
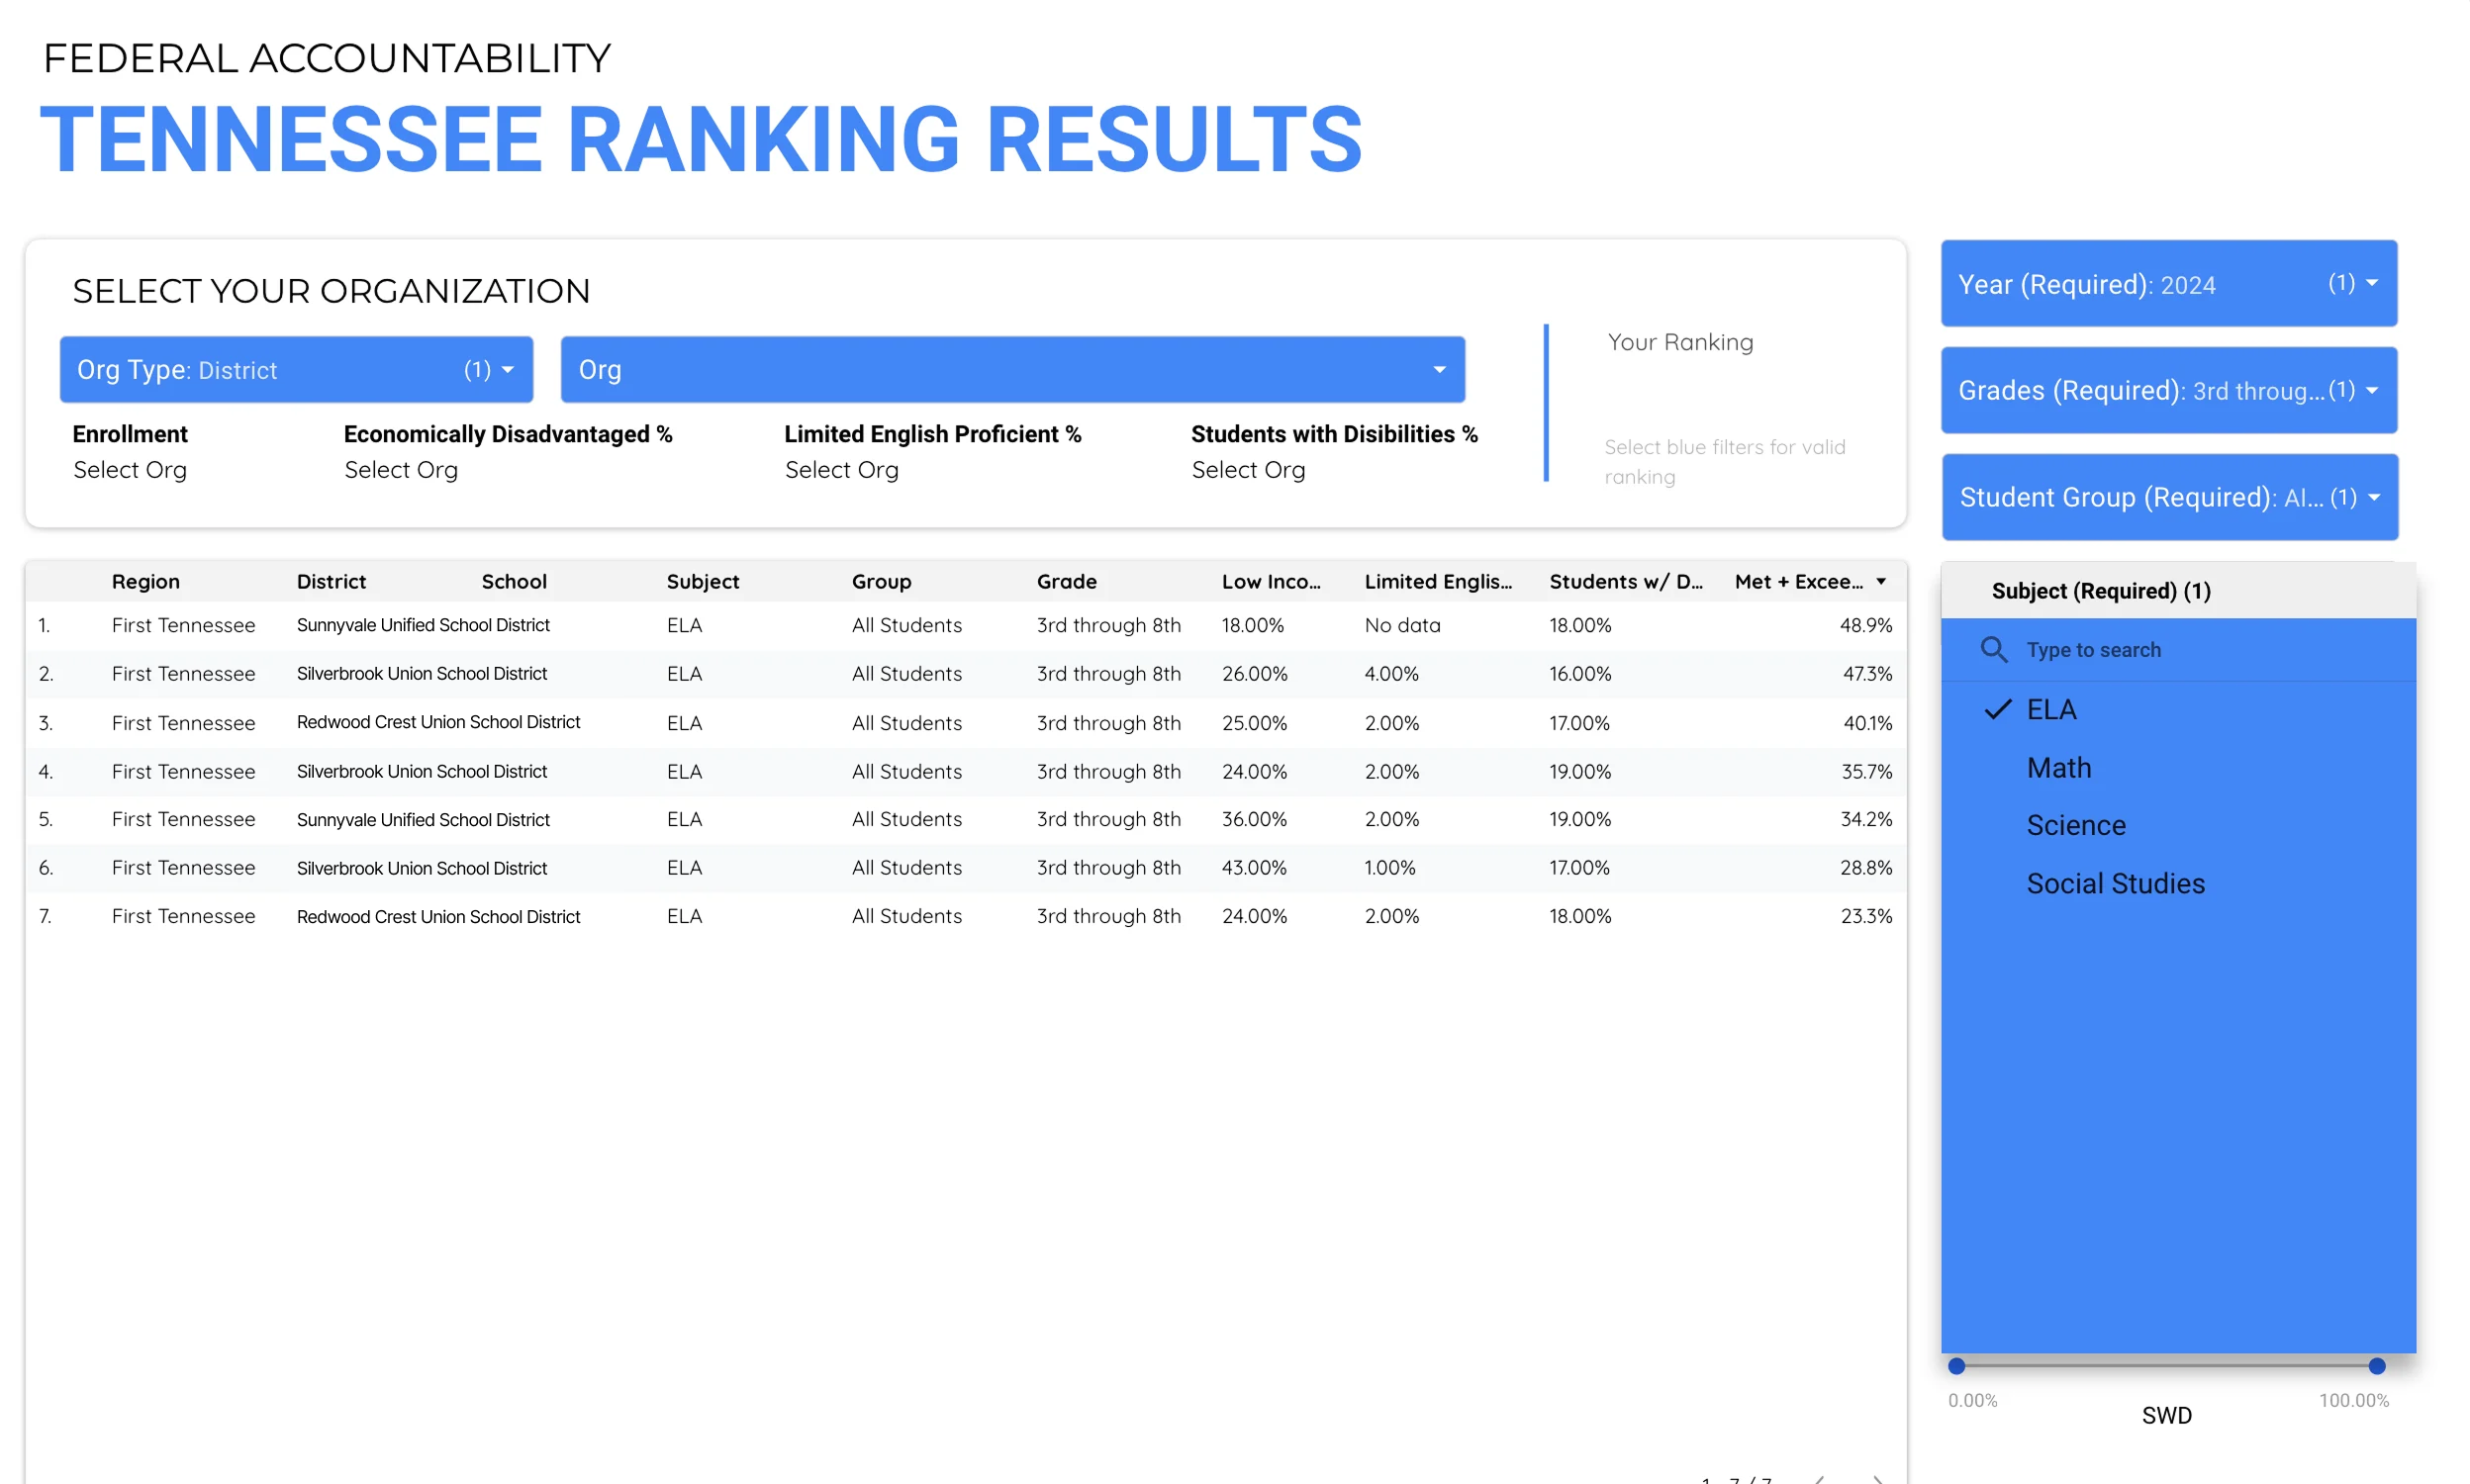
If your improvement plan focuses on a specific student group or subject, apply those filters now so you're looking at the most relevant slice.
Grounding questions
- Where do we rank among schools that actually look like ours?
- Is our position where we expected it to be — or does it surprise us?
Notice 10 min
What surprises us? Where do need and investment disagree? Which grade, subject, or student group stands out?
Now look more closely. This step is about observation, not explanation. Resist the urge to immediately justify what you see.
Grounding questions
- Which schools in our peer group are significantly outperforming us — and which are behind us?
- If we rank our schools by student need and by per-pupil spending side by side, where do the two lists disagree?
- Which grade level, subject, or student group stands out most — positively or negatively?
Learn 15 min
Who outperforms us with similar students? What might explain it? Who could we ask?
Identify one to three schools near the top of your filtered rankings that serve a student population similar to yours. These are your beat-the-odds peers — the most credible source of insight available because they've already solved problems under conditions like yours.
Click on a high-performing school in the rankings table to access their lead administrator's contact information.

Grounding questions
- Which school in our peer group has the strongest results on the measure we most need to improve?
- What would we want to understand if we visited or called them — their master schedule, intervention block, coaching model, curriculum approach?
- Are any of our own schools positive outliers that other districts could learn from?
Decide 15 min
What is one allocation decision, one practice to study, and one peer to contact?
This is the step most teams skip — and why most data conversations don't lead to change. Force three concrete decisions before anyone leaves the room:
| Decision type | What you're committing to |
|---|---|
| One allocation decision | Where should people, dollars, or attention shift based on what we just saw? |
| One practice to study | Which high-performing peer school does a specific thing worth investigating? |
| One peer to contact | Who will reach out to a lead administrator from the rankings table — and by when? |
Commit 10 min
Who owns each action, and when will we return to the data?
Decisions without owners disappear. Before the meeting ends, assign a name and a deadline to each of the three commitments from Step 4.
| Decision type | Owner | Due date |
|---|---|---|
| Allocation decision | ||
| Practice to study | ||
| Peer to contact |
Schedule your next protocol session before you leave. The teams that improve fastest are the ones who return to the data on a rhythm — not just when a designation arrives.
Want to take this further?
This protocol works with the data available in Clarity Rankings. But the "Learn" step gets significantly more powerful when you can see whether a peer school's strong results are a one-year spike or a sustained multi-year trend — and which specific student subgroups are driving them.
Both of those views are available in the Clarity platform.
Curious what your peer analysis could look like with multi-year data?
Talk with our teamWas this article helpful?
What was missing?