
This is a title
Navigating Dashboards
Why this matters
Beyond the Rankings table, Clarity Lite includes a slice of the public California School Dashboard — a quick way to see trends and subgroup breakdowns for the data you're already exploring, without leaving the platform.
Who it's for
- Administrators who want a fast visual read on trends and student groups
- Anyone moving from a single ranking to the story behind it over time
Step-by-step
1
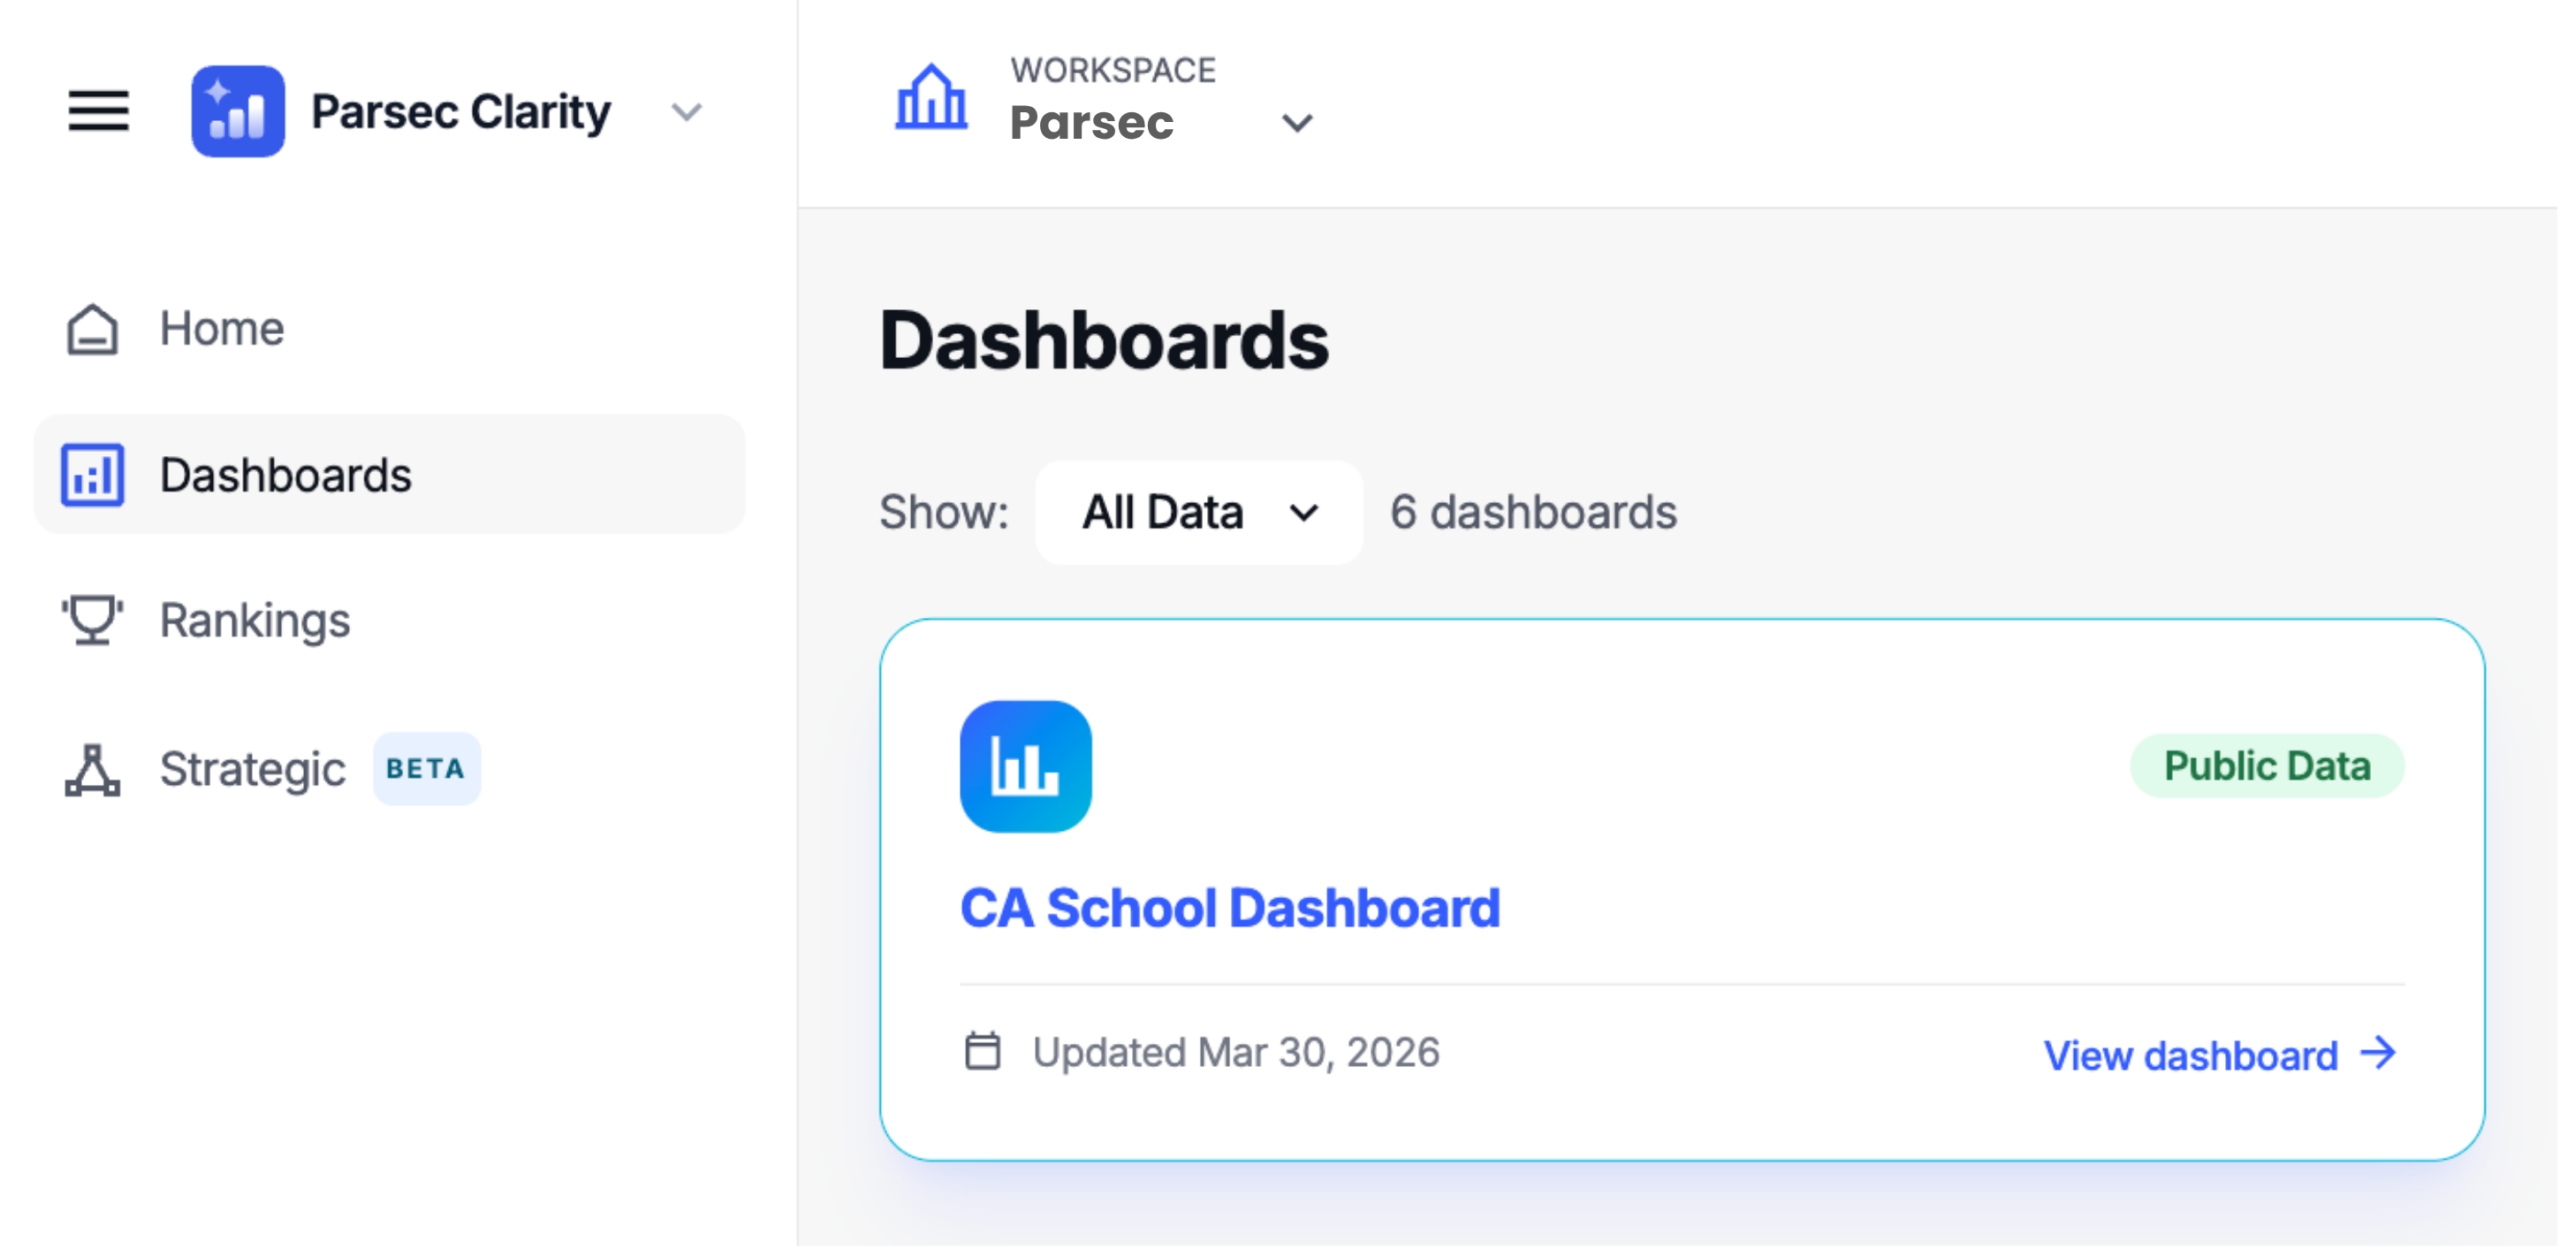
Open Dashboards
Click Dashboards in the left navigation. In Clarity Lite this is a focused, vertical slice of the full public California School Dashboard.
2
Read the trends and breakdowns
Inside, you'll find:
- Trend data — how a metric has moved over time
- Student group data — performance broken out by subgroup
- Comparison data — how the numbers stack up in context
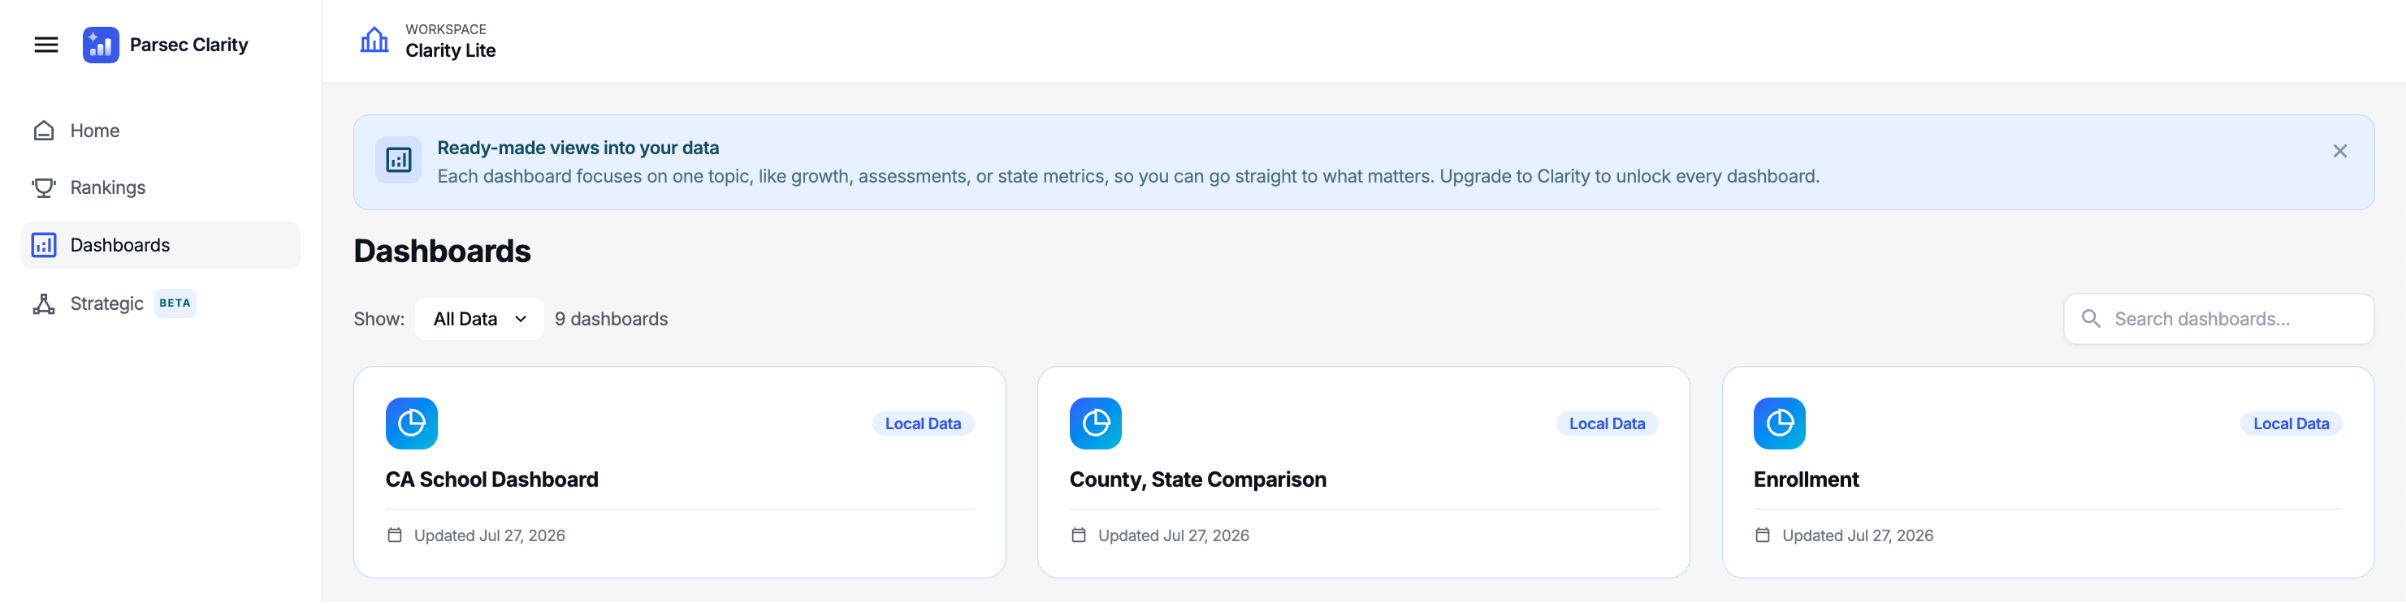
Want the full picture? The complete California School Dashboard, with deeper trend and subgroup detail, lives in the full Clarity platform. This slice is here to give you the essentials.
Was this article helpful?
Thanks for your feedback!
What was missing?