This is a title
How to Use Clarity Rankings
Why this matters
Most schools and districts already have access to state accountability data — but raw data alone doesn't tell you much. The real question is: how are you performing compared to systems that look like yours?
Clarity Rankings helps you answer that. Instead of comparing your district to the state average (which isn't a fair comparison), you can filter down to school systems with similar enrollment size, student demographics, and community characteristics — and see exactly where you rank.
And when you find a system that's outperforming yours? You can reach out to them directly.
Who it's for
Clarity Rankings is useful for anyone trying to understand school or district performance in context — not just in isolation. That includes:
- District and school administrators benchmarking performance ahead of board meetings, strategic planning cycles, or state reporting
- Curriculum and instruction leaders looking for high-performing peer systems to learn from
- Community members and advocates who want to understand how their local schools compare to similar ones across the state
No prior data experience required. If you can use a filter in a spreadsheet, you can use this platform.
Step-by-step
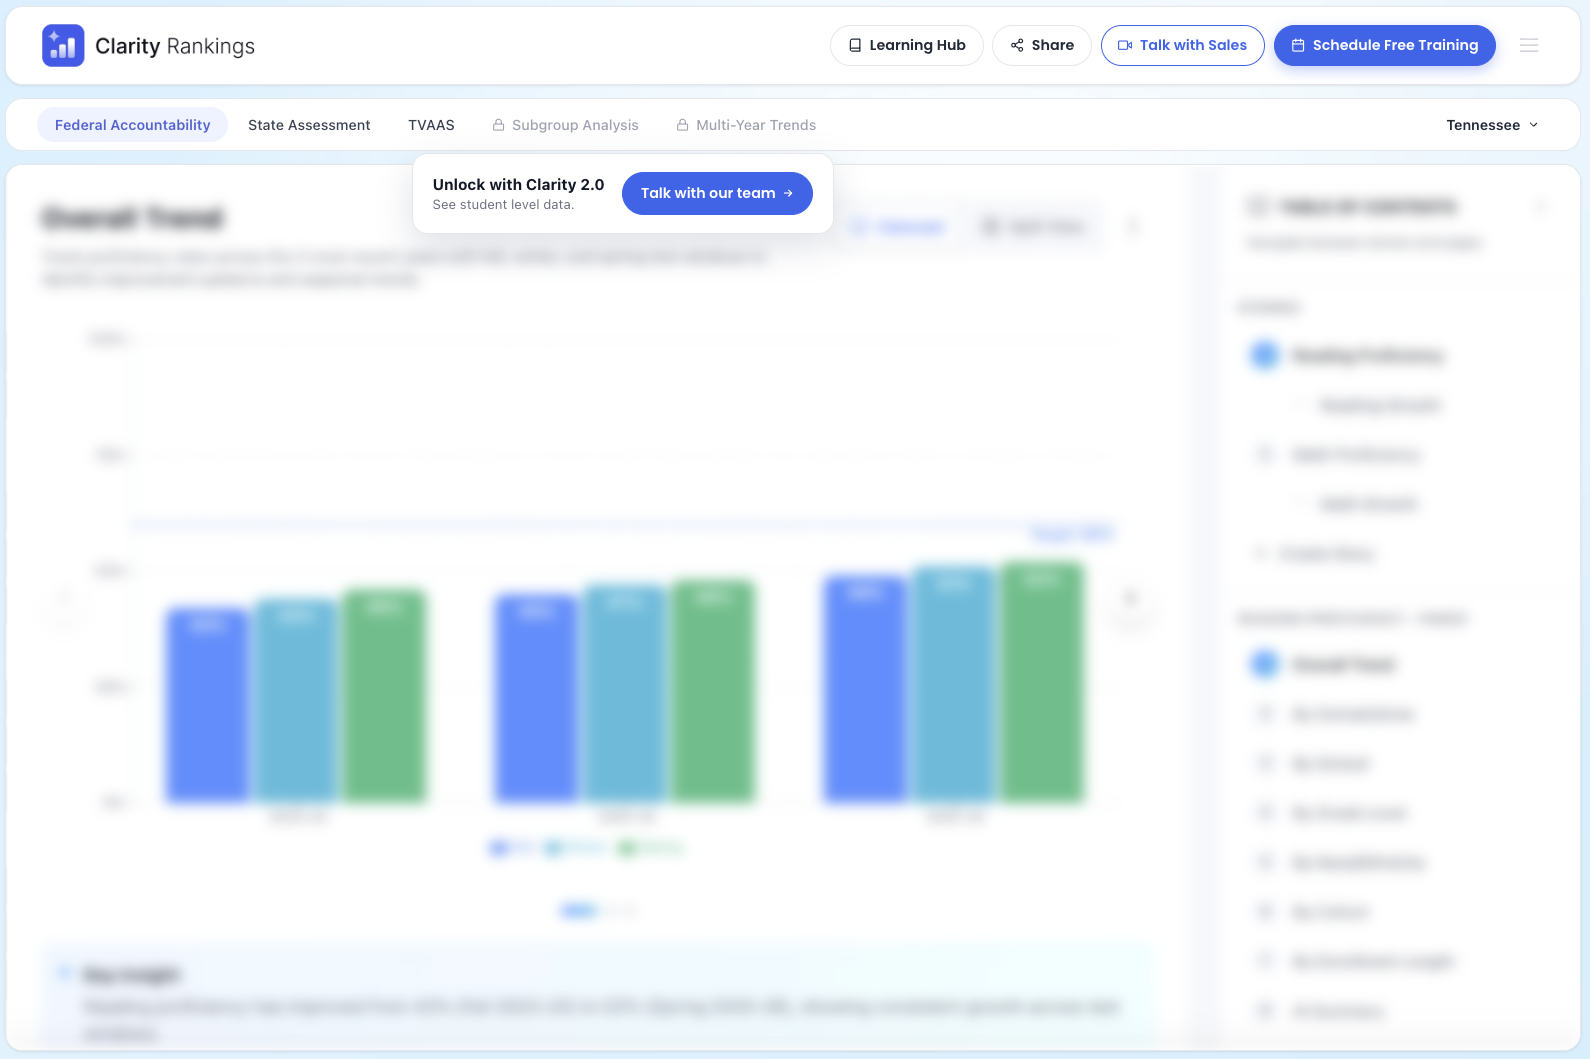
Log in and navigate to Rankings
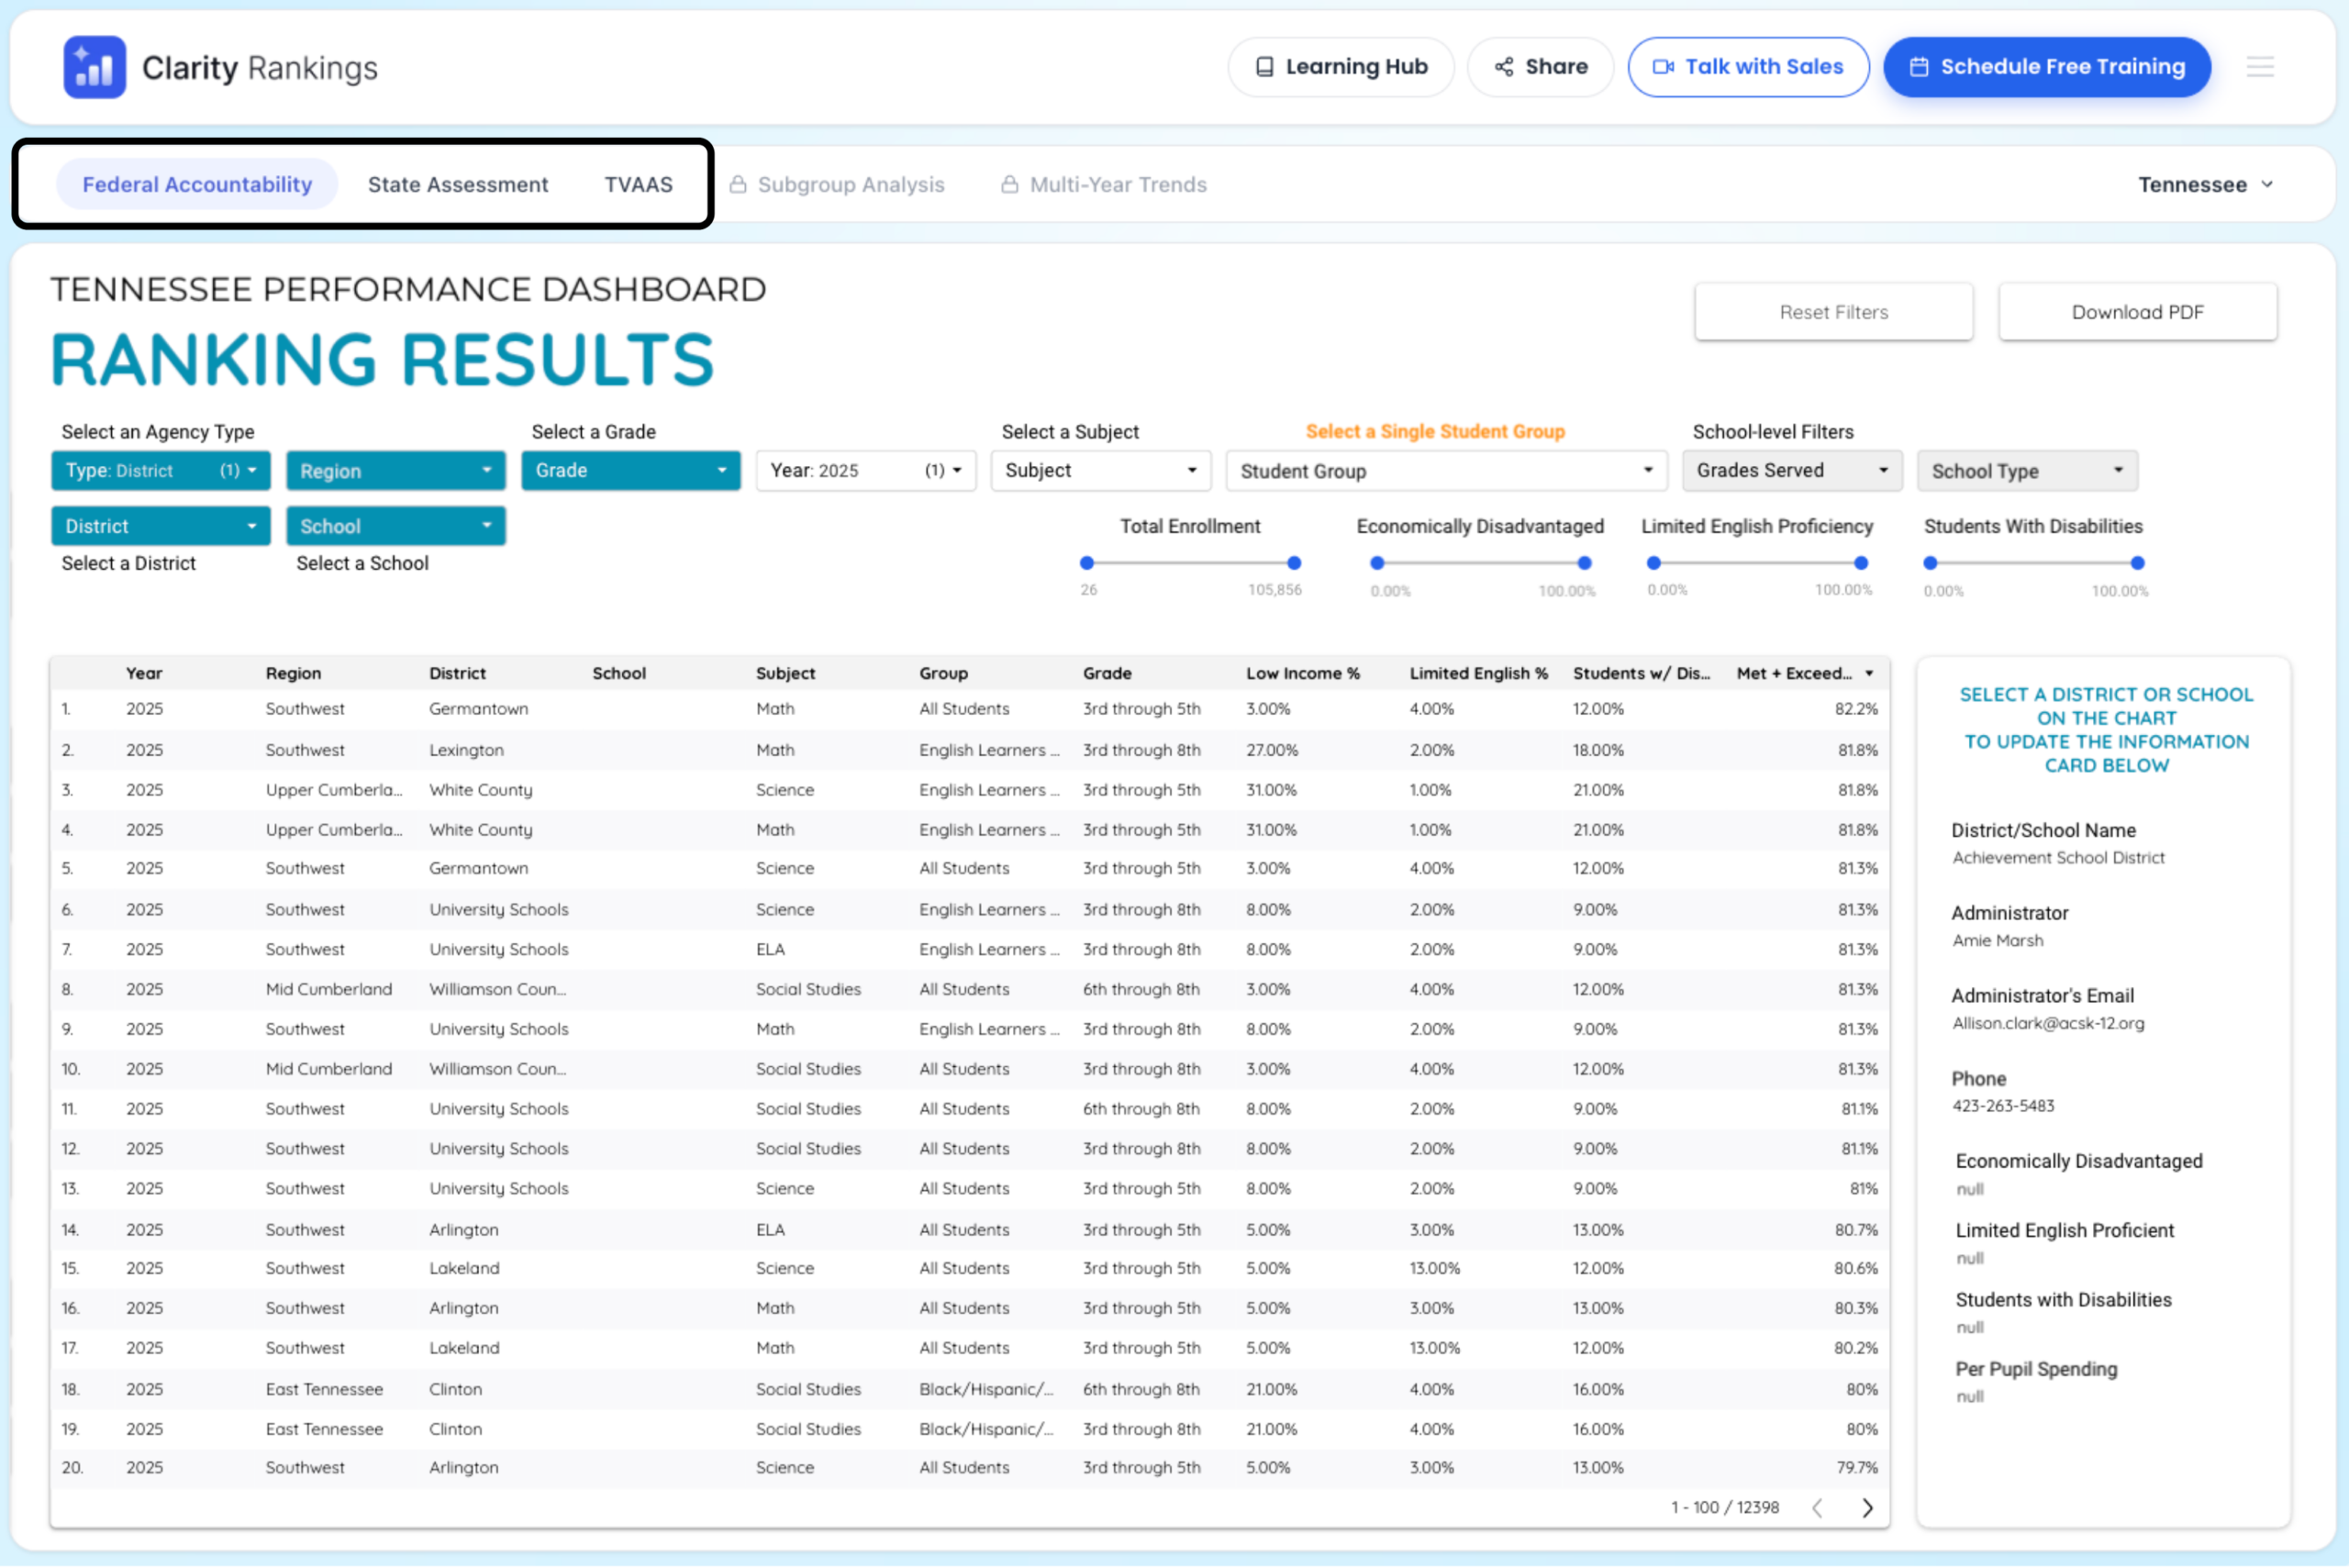
Once you're logged in, you'll be able to see the three ranking reports available:
| Report | What it measures |
|---|---|
| Federal Accountability | How schools and districts are meeting ESSA requirements — achievement, growth, graduation rates, English learner progress, and chronic absenteeism |
| State Assessment | Student proficiency on Tennessee's TCAP standardized tests across math, ELA, science, and social studies |
| TVAAS Growth Model | How much academic growth students made year-over-year, regardless of starting point — a measure of a school's impact on learning |
Click any report to open the rankings table.
Set your comparison filters
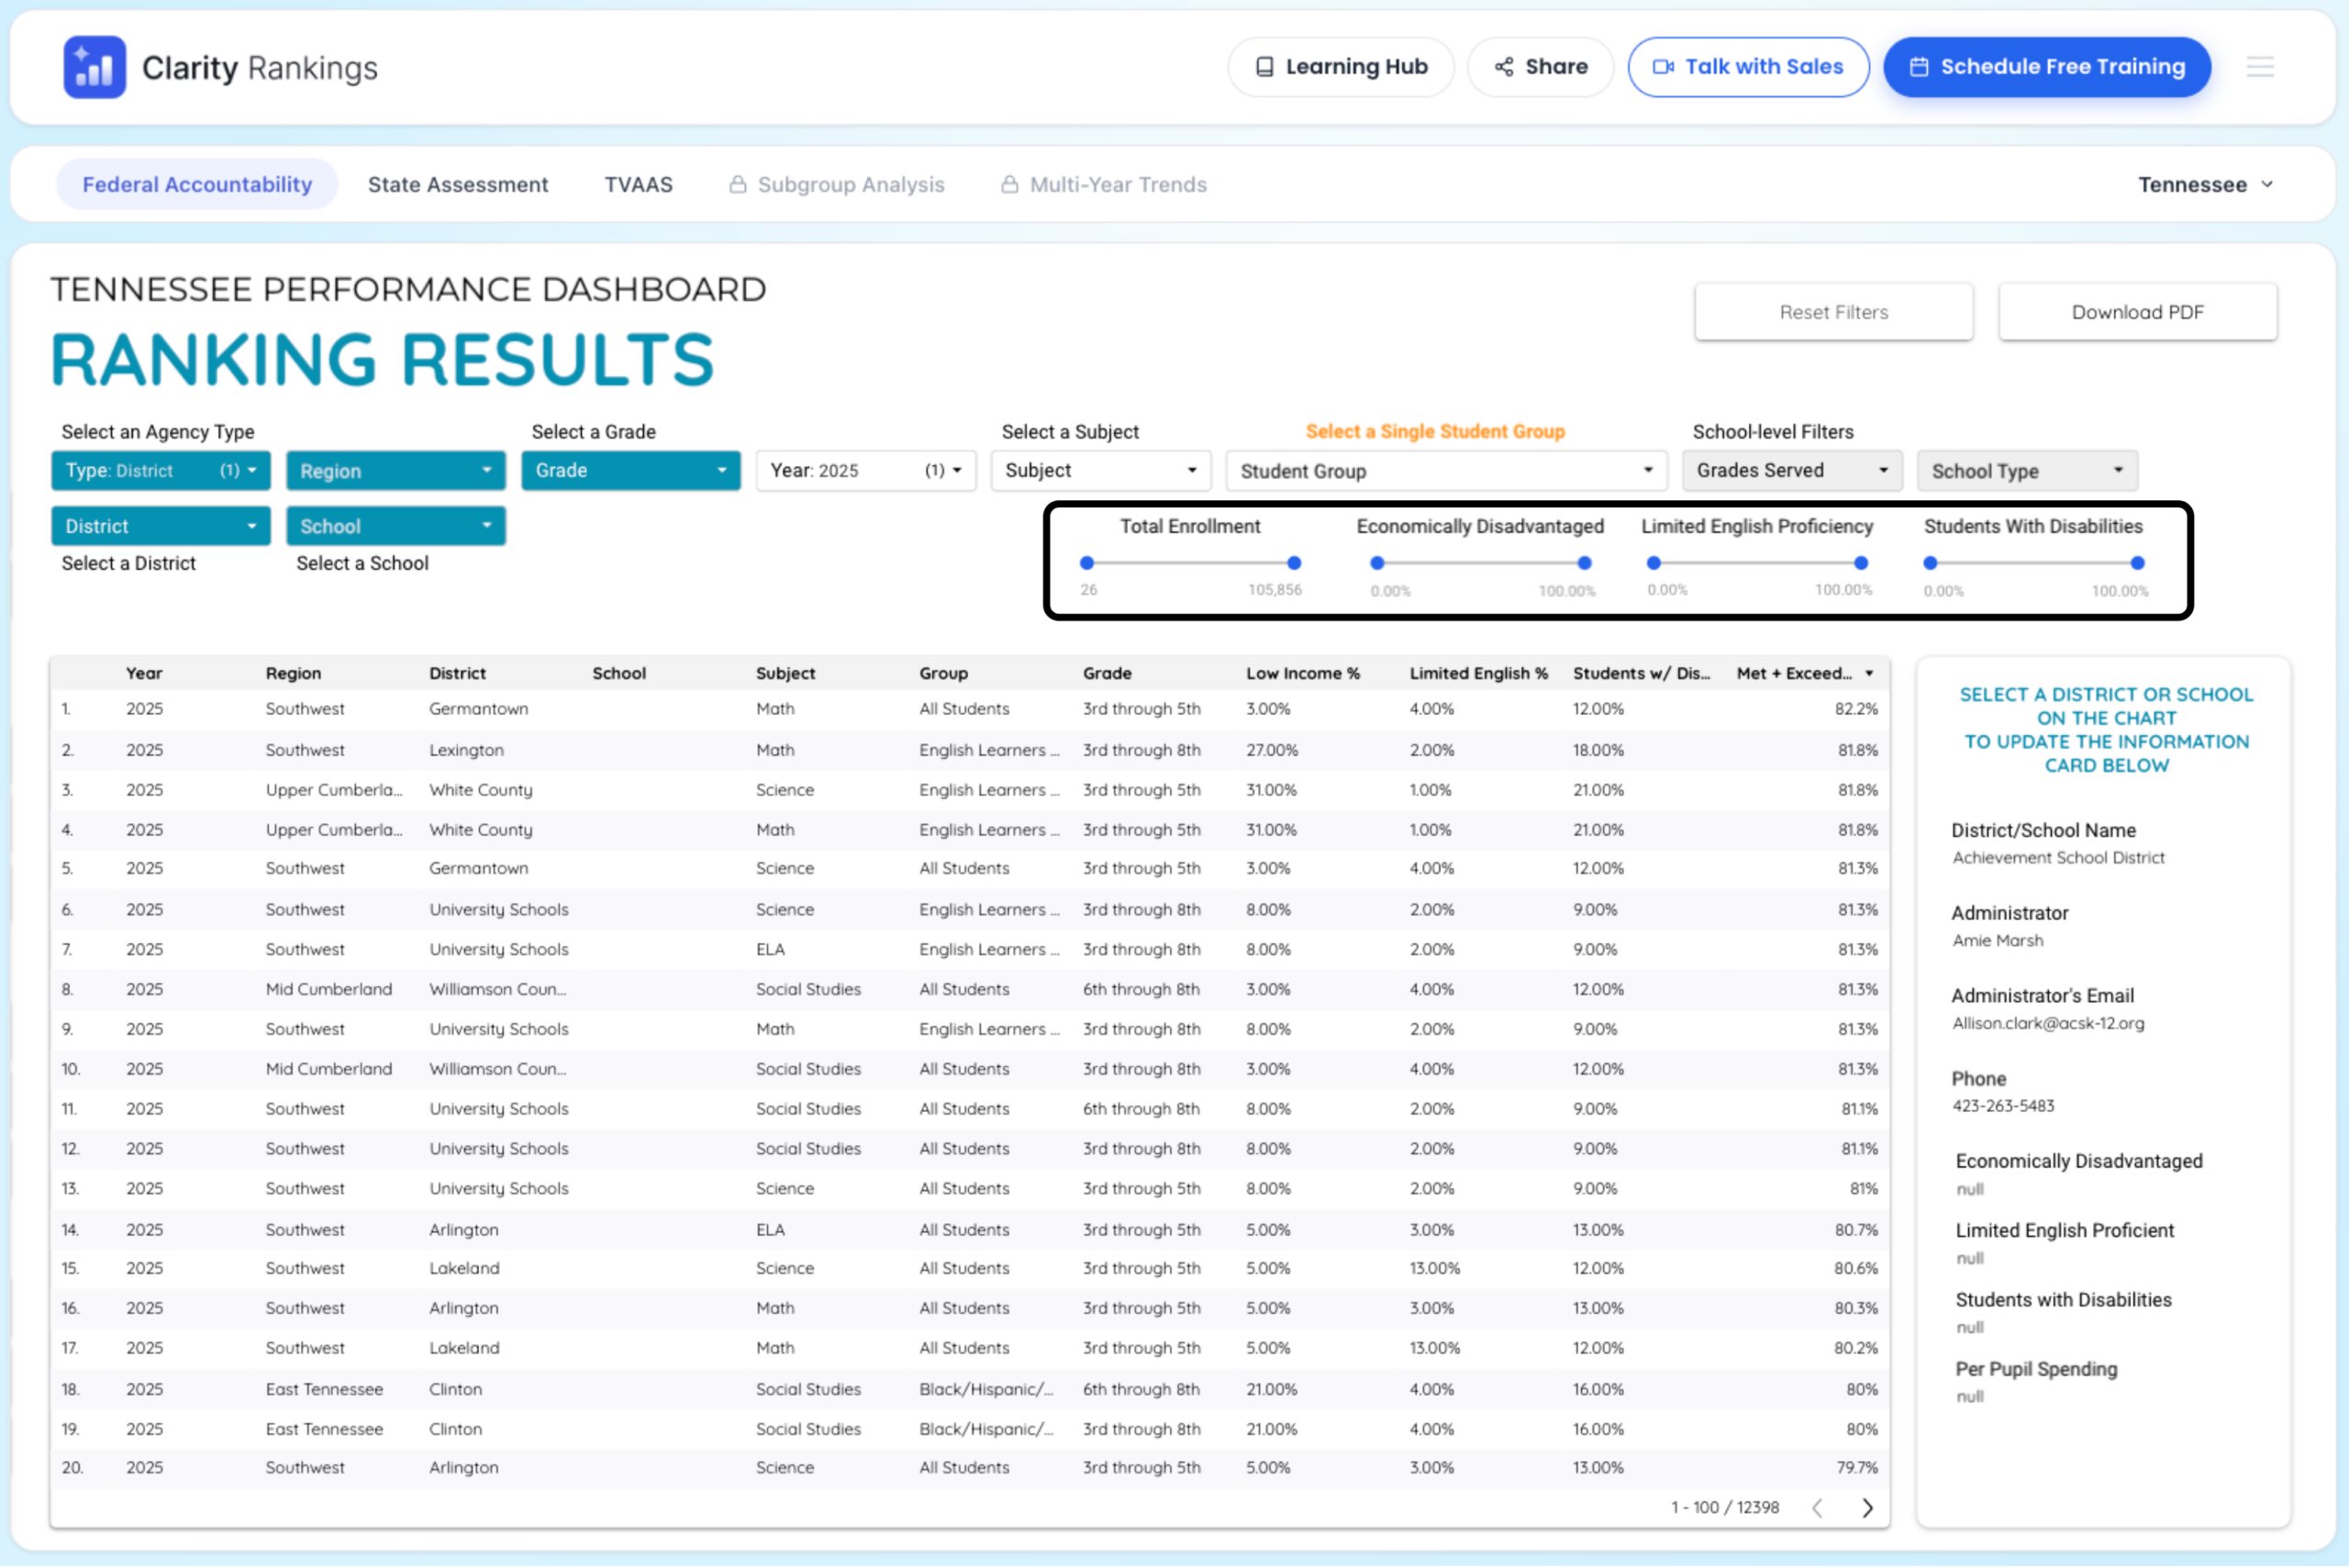
This is where Clarity Rankings gets powerful. Before you look at any rankings, use the filters to define what "similar systems" means for you. You can filter by:
- Total enrollment — compare against schools or districts your size
- Economically disadvantaged percentage — match on student need level
- Limited English proficiency percentage — account for ELL population differences
- Students with disabilities percentage — factor in special education population
Choose your view
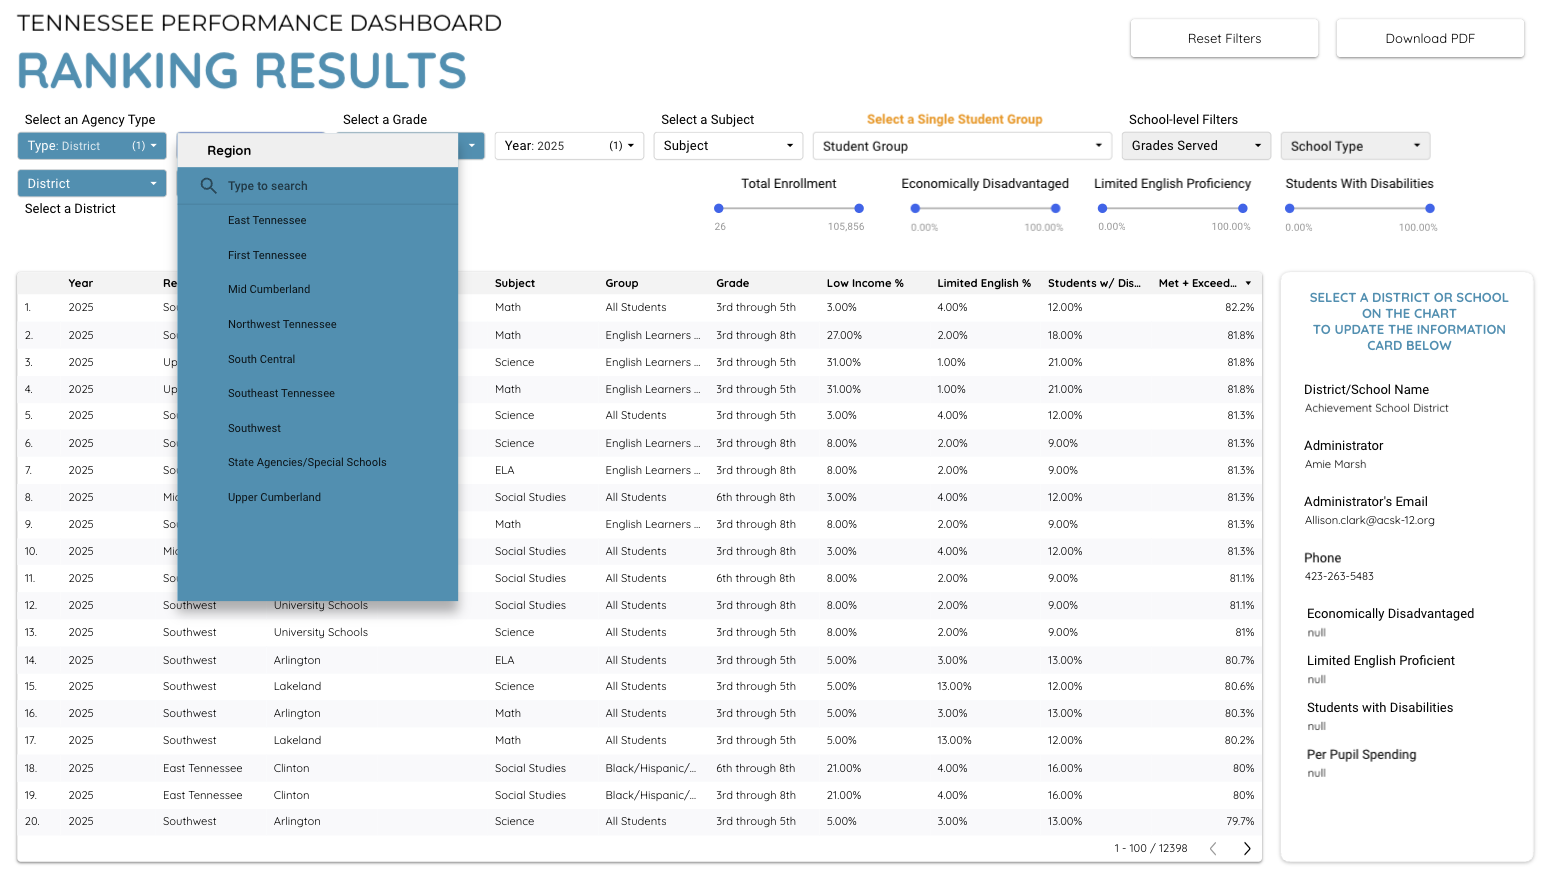
Once your peer filters are set, you can customize how you view the data:
- District or school level — zoom in or out depending on what you're analyzing
- Region — focus on geographic peers if that's relevant to your context
- Grade level — useful if you're looking at a specific school level (elementary, middle, high)
- Year — look at a single year's performance
- Subject — drill into math, ELA, or other subject areas
- Student group — break down performance by subgroup
Tip: Start broad, then narrow. Open the full rankings table first so you can see the full range of how similar systems perform, then filter down to the specific view most relevant to your question.
Find a high-performing peer and reach out
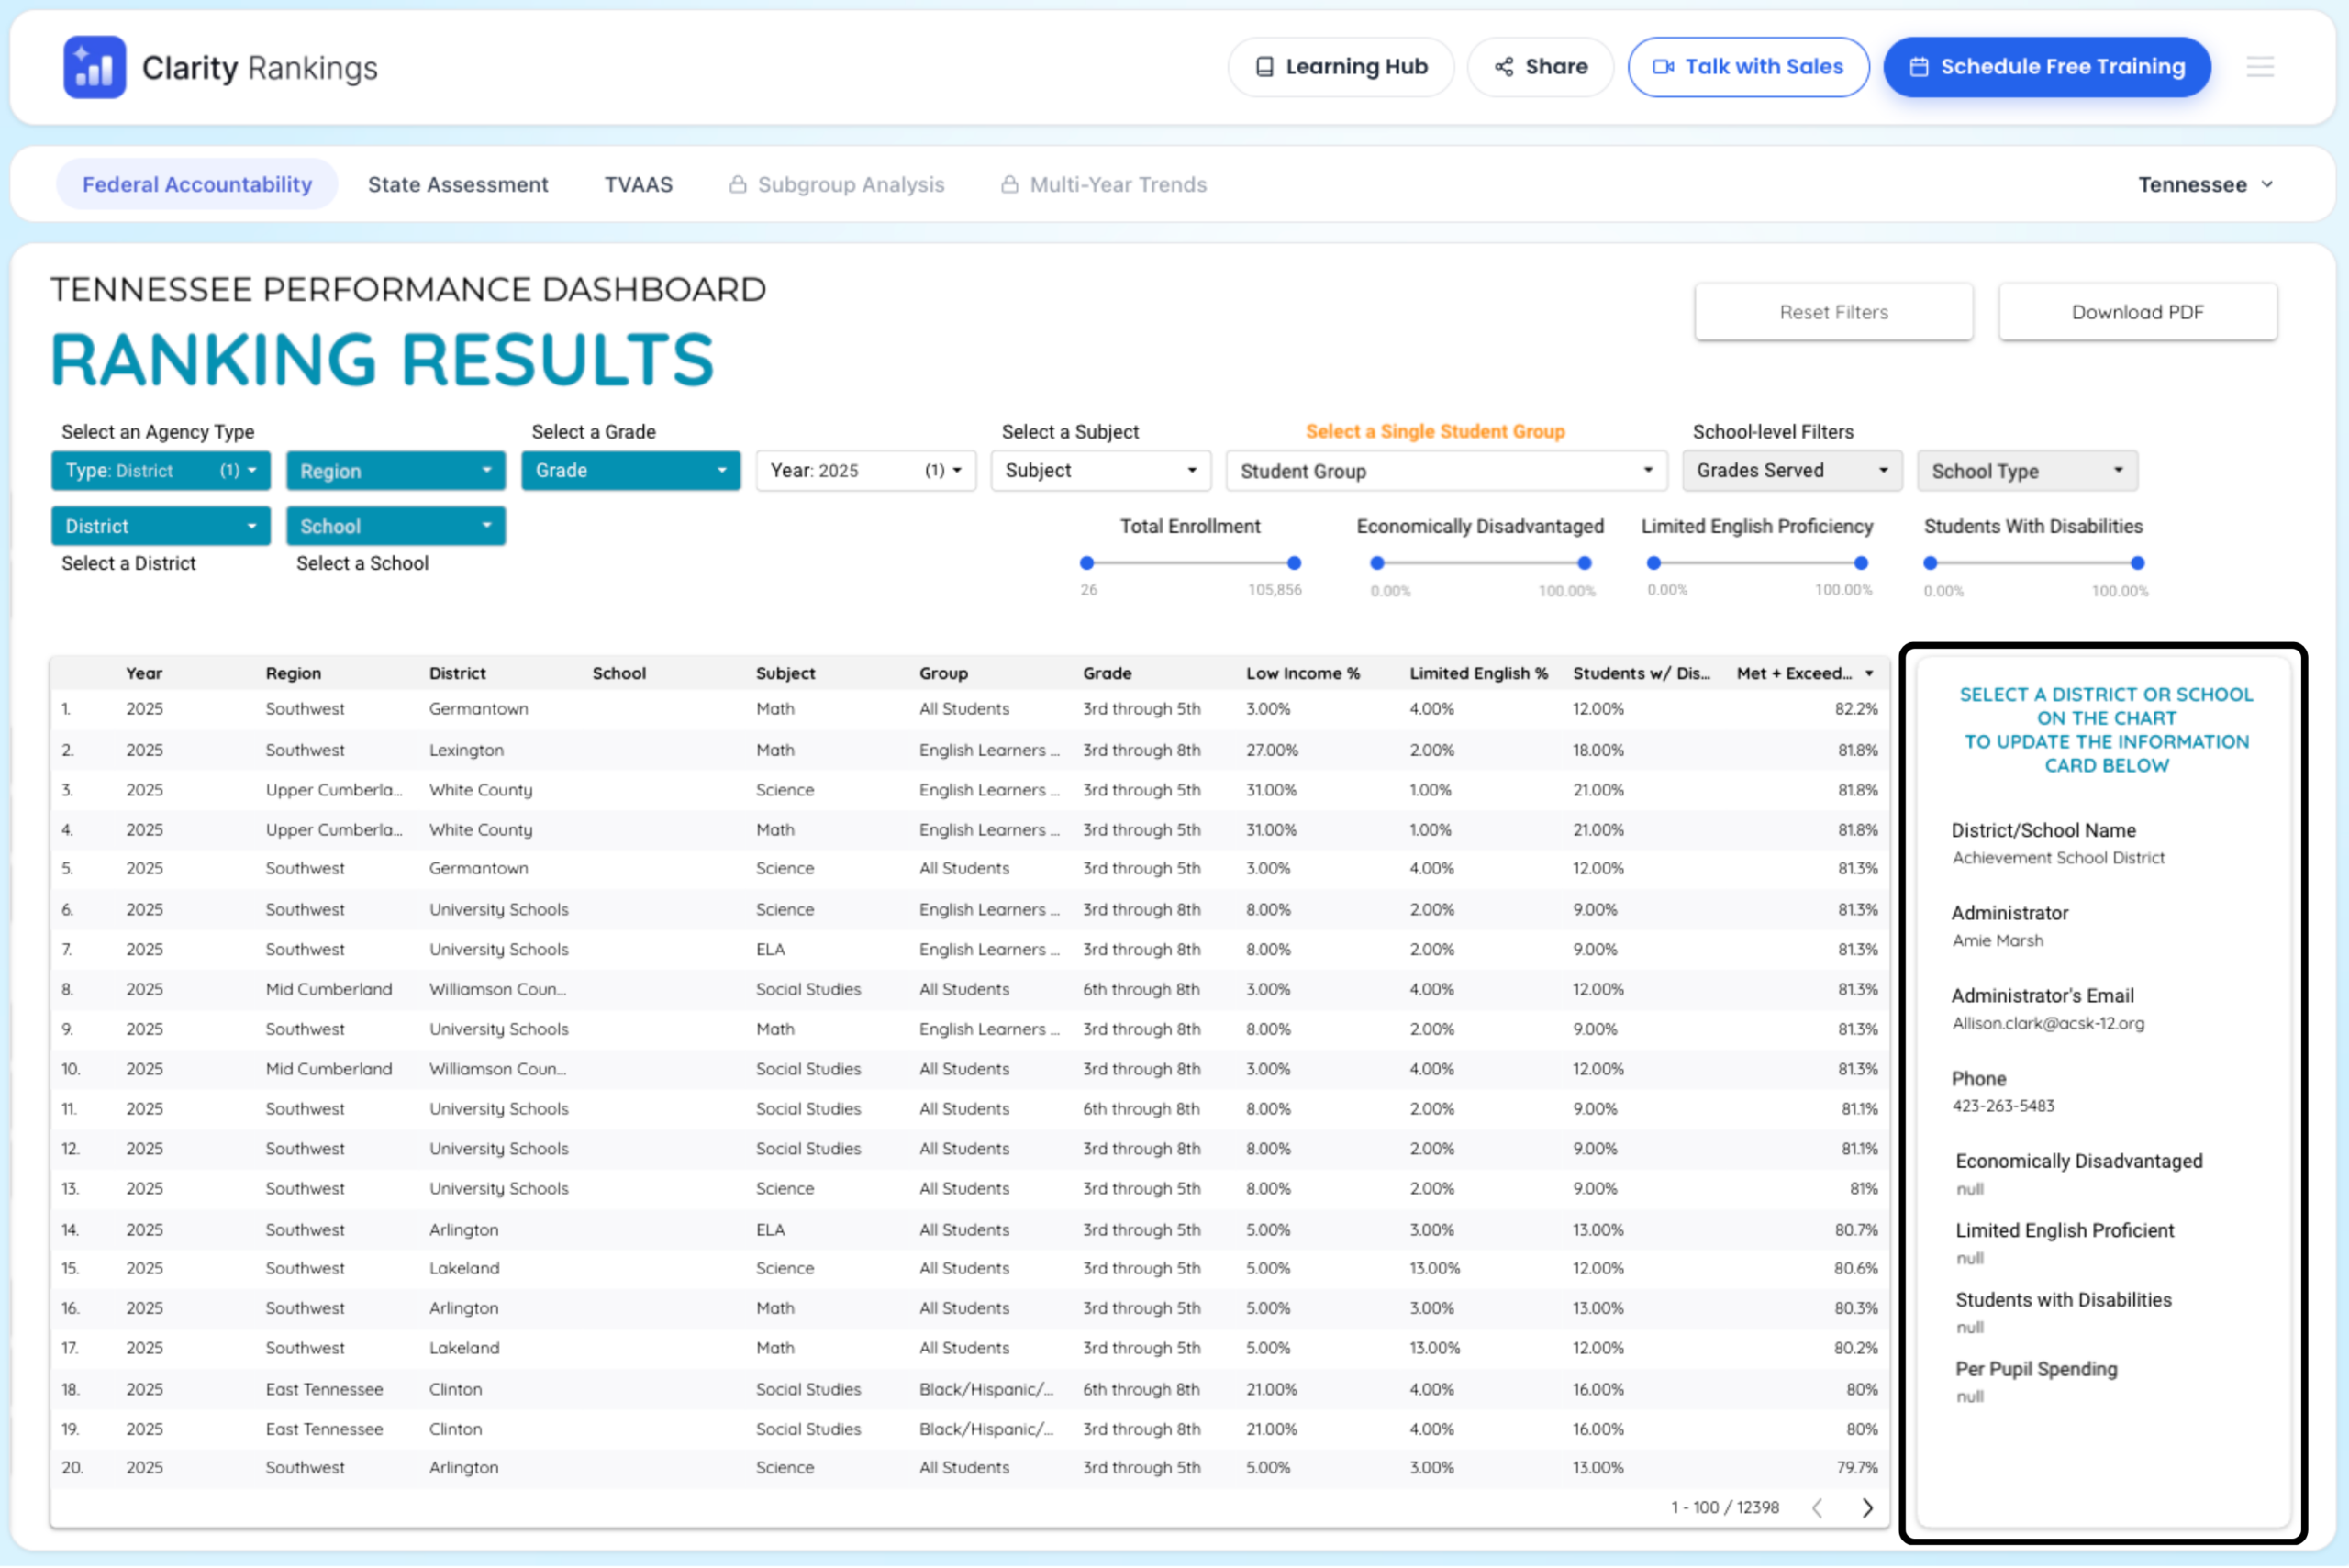
Once you've identified a school system that's performing well on a metric you care about — and that looks like yours — click on their name in the rankings table to access lead administrator contact information.
This is the feature that turns data into action. Instead of wondering how a comparable district improved their TVAAS scores, you can ask them directly.
Locked Reports
As a free user, you'll notice two additional reports in the platform that are currently locked:
- Multi-Year Trends — see how performance has changed over time, not just a single snapshot
- Subgroup Analysis — break down performance by specific student populations in depth
These reports are available when you upgrade to the Clarity platform. If you find yourself wanting to go deeper — tracking whether a peer system's improvement is a one-year spike or a sustained trend, or understanding which student groups are driving a school's rankings — that's exactly what Clarity is built for.
Was this article helpful?
What was missing?