
This is a title
Navigating Your Dashboards (Public vs Local)
Watch the tutorial
Why this matters
Clarity has a lot of dashboards, split into two categories — Public and Local — that draw on very different data. Knowing which is which (and how to jump between them) gets you to the right view fast instead of scrolling through everything.
Who it's for
- Administrators and site leaders pulling state or local data for a quick read
- Longtime Parsec users adjusting to the new Public/Local naming (formerly Standard/Premium)
Step-by-step
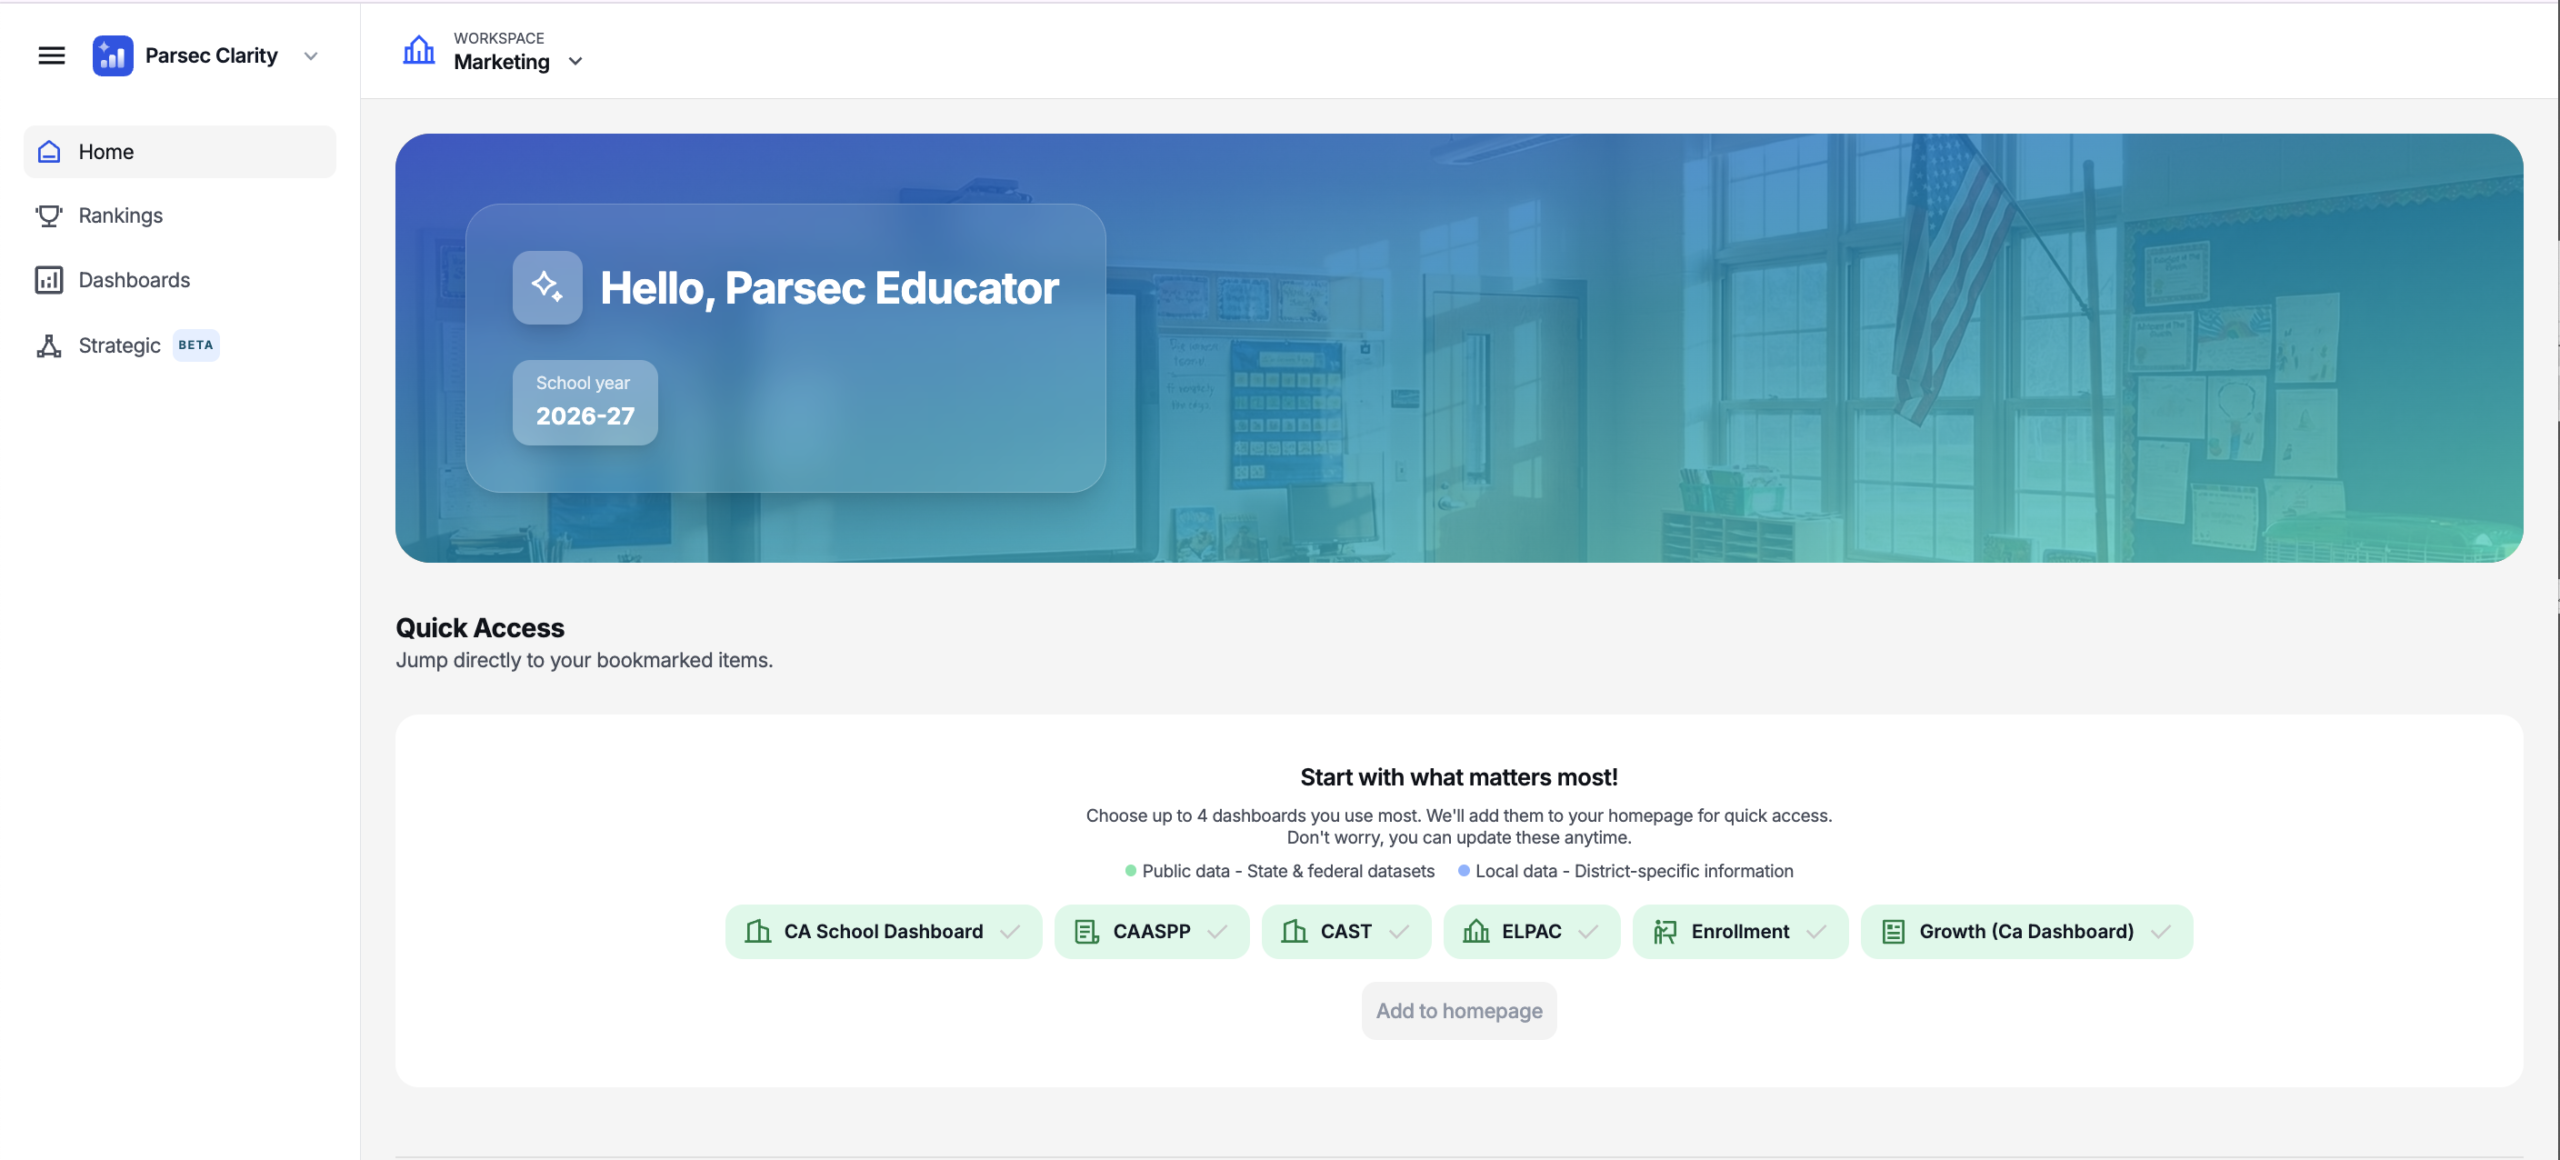
Start on your homepage
Once you've logged in, confirm you're in the right spot and the right workspace — your name and workspace name are both on screen. A workspace might be your district or a specific site, and you may have more than one.
Open Dashboards
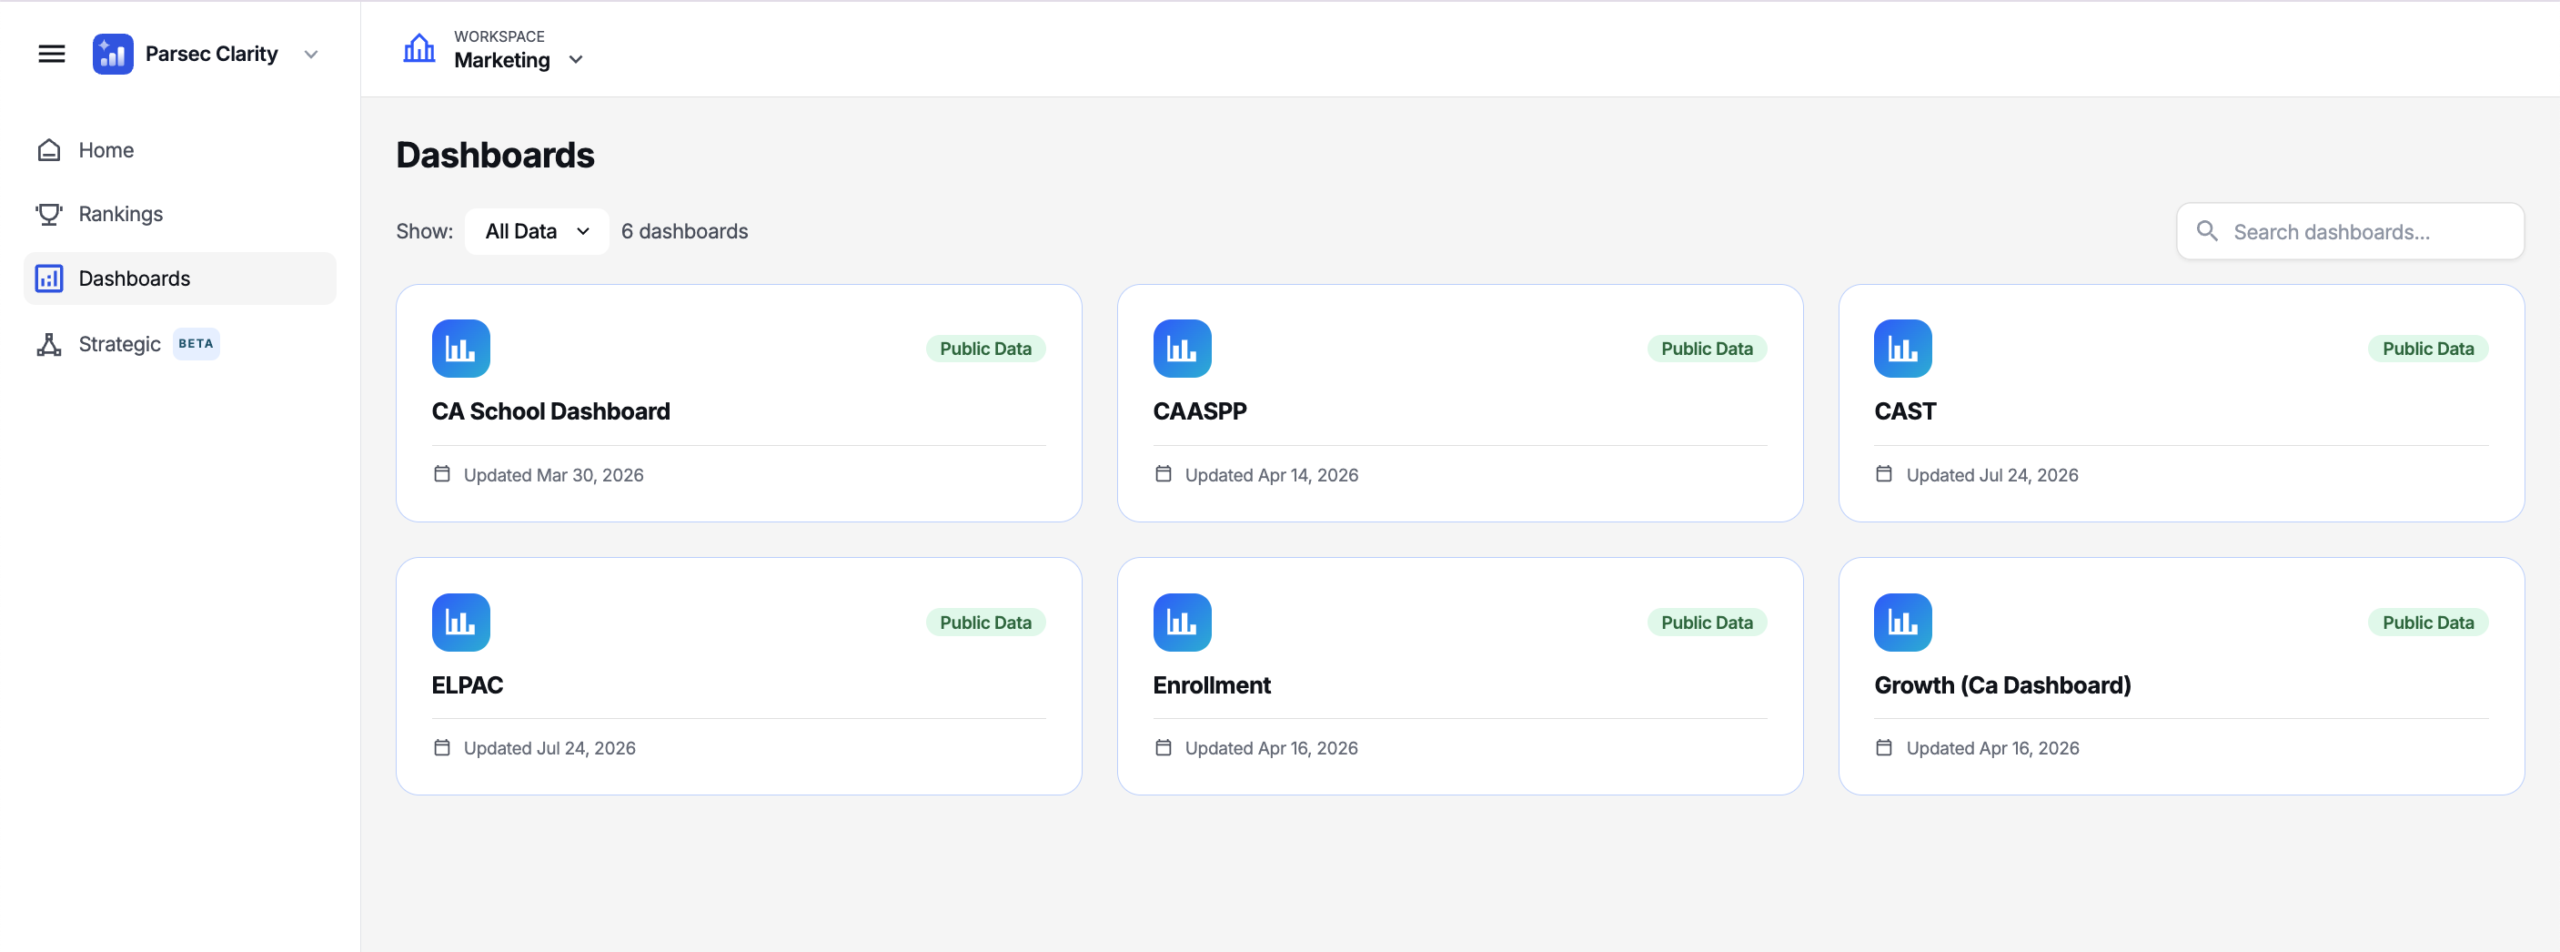
Click Dashboards in the left-hand navigation. You'll see a lot of them — so there are two ways to find what you need:
- Type to search — if you just want your state test dashboard, typing the name is quick and dynamic
- Filter by category — use the Public/Local dropdown (next step)
Filter between Public and Local
The dropdown on the left filters between the two categories:
- Public — built on publicly available research file data (this is everything that used to live under Standard). These dashboards got a facelift in the new edition of Analytics.
- Local — student-level data (everything that used to live under Premium)
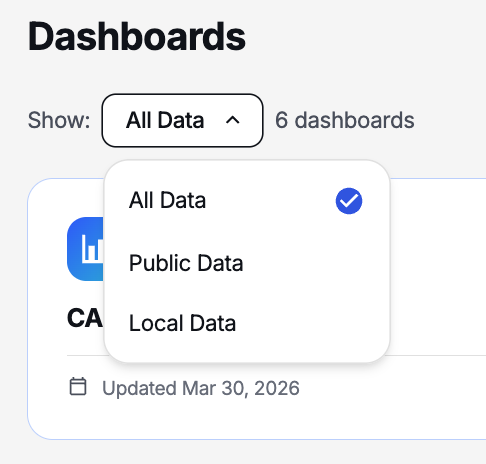
Nomenclature shift: If you've been with Parsec a while — Public is the old Standard, and Local is the old Premium. Same idea, new names.
Jump into a Local dashboard
Click a dashboard's name and scroll down to reach your Local dashboards. Pick one — for example, iReady — and it pulls in your student-level data.
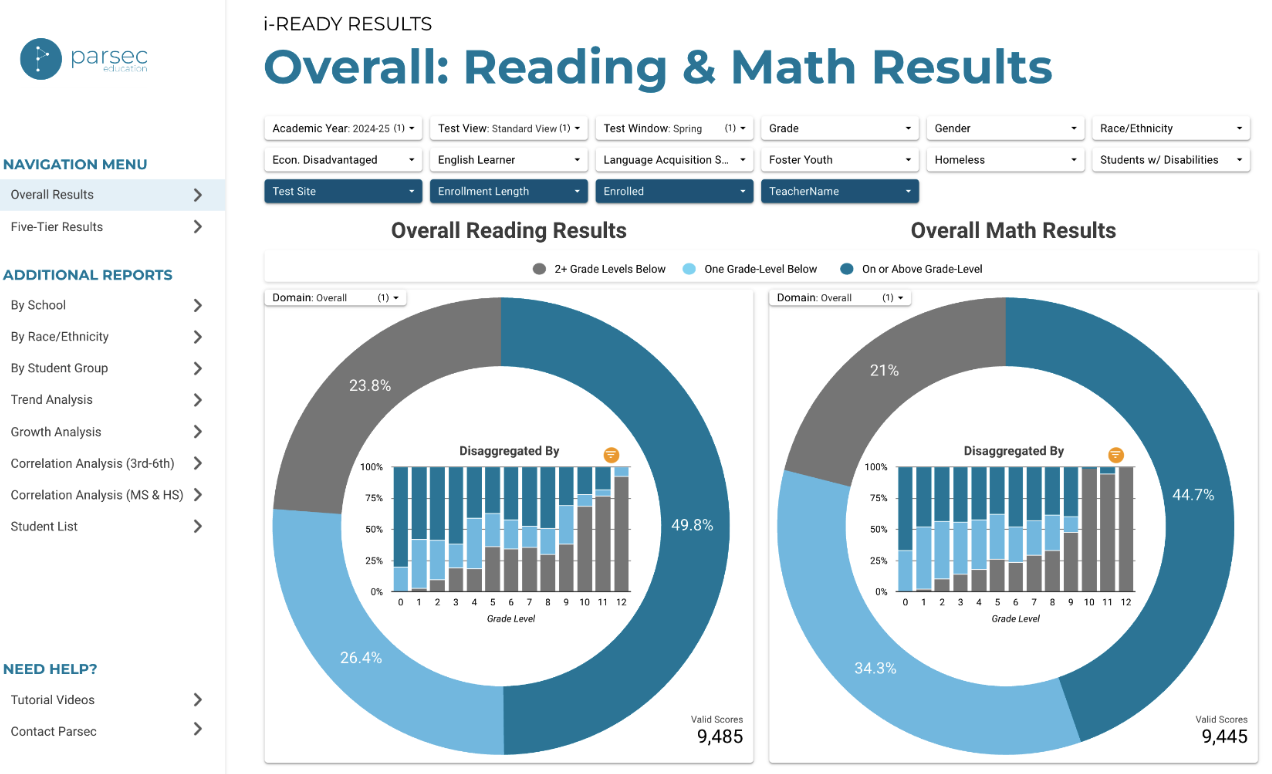
That's the core distinction: Public is research file data; Local is student-level data. Vary your view with the dropdown filter, or type a specific name.
Was this article helpful?
What was missing?